
I recently came across a ranking of countries by average reported happiness. This year’s World Happiness Report, released on March 20, uses data from the Gallup World Poll to calculate average reported happiness by country for over 150 countries for years 2005 to 2020. The focus of the report is on the impact of COVID-19 on happiness in 2020 by comparison with years 2017-2019. I was interested to see to what extent modern versus premodern religious values might explain variations in happiness across countries, along with a number of other factors that were examined in the World Happiness Report. I have posted here previously on my analysis of premodern or “fundamentalist” religious values.
The main measure used for happiness in the World Happiness Report is based on the national average response to the question on life evaluation in the Gallup World Poll (GWP). The English wording of the question is “Please imagine a ladder, with steps numbered from 0 at the bottom to 10 at the top. The top of the ladder represents the best possible life for you and the bottom of the ladder represents the worst possible life for you. On which step of the ladder would you say you personally feel you stand at this time?”
The following graph shows the happiness rankings of 101 countries for which I have both happiness measures and estimates of the modern/premodern religious values index I developed (see here). The happiness scores are averages for years 2017 to 2019.
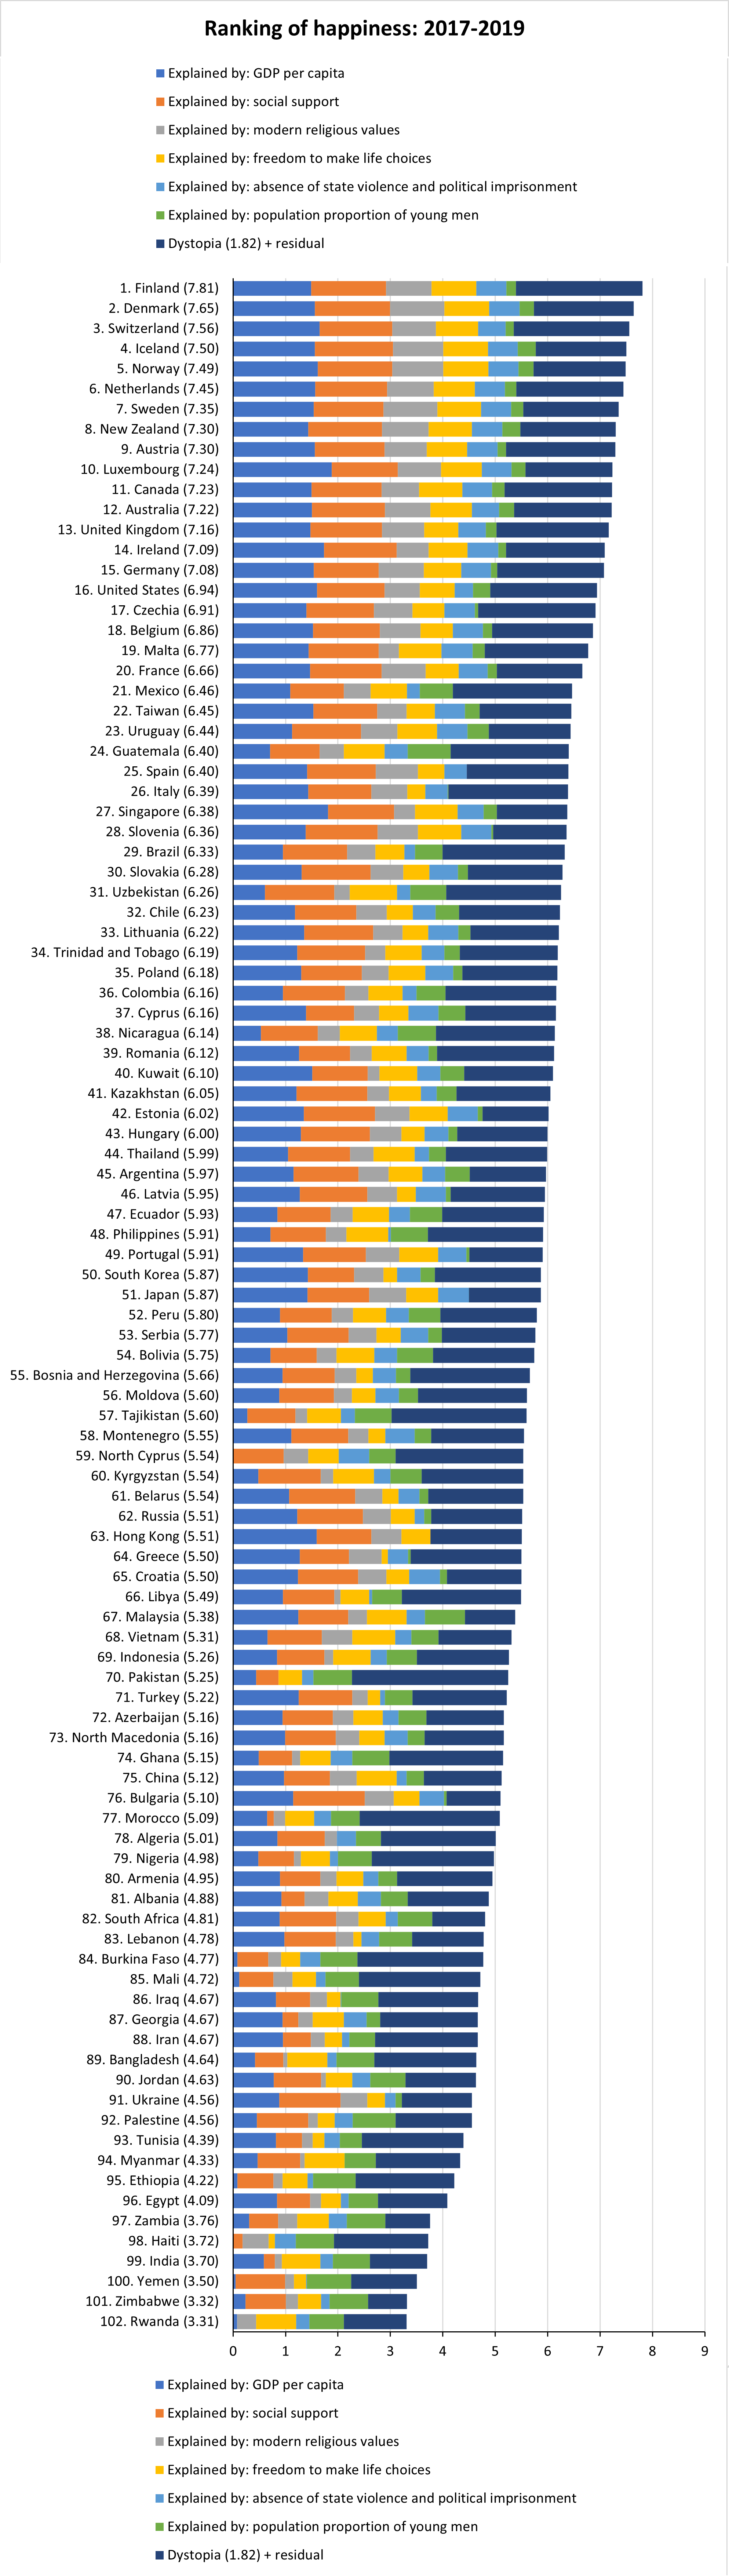
Finland holds the rank of the happiest country in the world, with an average score of 7.81 on the 0-10 scale. It is followed by Denmark, Switzerland, Iceland and Norway. Among the 101 countries included in the chart above, Australia came in at 12th position with a score of 7.22 and the USA in 16th position with a score of 6.94. The countries with the lowest scores on the graph were Rwanda, with Zimbabwe, Yemen and India just above it. Afghanistan received the lowest score, followed by South Sudan among all the countries included in the World Happiness Report.
The World Happiness Report also includes the results of a regression analysis used to attribute the average reported happiness score of each country for years 2018-2020 to its average income, healthy life expectancy and four social factors: social support, freedom to make life choices, generosity and perceptions of corruption. I carried out a similar regression analysis for 2017-2019, drawing on a wider range of potential explanatory factors. For details of this analysis, including data sources and definitions of variables, see here.
The final regression model included gross domestic product (GDP) per capita, my latent variable for premodern/modern religious values, three other social factors, and a demographic variable. The contribution of each of these to the overall happiness score is shown as coloured regions on each bar. Overall, these six variables explained 84% of the variance in happiness across the 101 countries.
The final dark blue bar includes two elements. The first is the residual error, the part of the national average that our model does not explain. The second is the estimated average happiness in a mythical country called dystopia, since its score is the model’s predicted score (1.82) for an imaginary country having the world’s worst observed values for each of the six variables. With dystopia and the residual included, the sum of all the sub-bars adds up to the actual average happiness score on which the rankings are based.
Across all 101 countries on average, GDP per capita and social support each explained around 17-18% of the total happiness score, followed by freedom to make life choices (10%), modern religious values (8%), population proportion of young men (8%) and state repression (7%). Explanatory values vary substantially across individual countries of course.
The proportion of young men in the populatin was included as a potential variable because it is an explanatory variable for higher rates of homicide. Based on this association, I expected the model to estimate a negative coefficient for it, but in fact it is positive, so higher proportions of population being young men are associated with increased happiness. I have no idea whether this reflects any sort of real causal association or not. The association of self-reported happiness with age is generally U-shaped with declining happiness to mid-life and then increasing again. So possibly higher proportions of young men in the population is simply a marker for higher proportions of happier people (male and females).
It is of course not possible to conclude that any of the associations found here are necessarily causal, or that the estimated contributions reflect the real overall contributions if causal pathways could be identified between the various predictors as well as with the outcome happiness measure. However, it seems likely to me that average income per capita, social support, freedom to make life choices, and more modern religious values are indeed all independent causes of increased happiness, although there may well be more complex causal pathways (such as higher income giving more freedom to make life choices, as would more modern religious values) and also that some of these variables may be acting in part as markers for other unmeasured causes of happiness.
I tested inclusion of my religiosity variable in the regression analysis also, but its contribution was not statistically significant. Religiosity is a continuous variable reflecting the population distrubutions of practicing religious, non-practicing religious, non-religious and atheist. I should also mention that while there are differences in the modern religious values variable across these religiosity categories, differences are much larger across countries than between groups within countries in general. For a country dominated by premodern religious values even the atheists tend to share values closer to those of their religious neighbours than to atheists in countries with more modern religious values.
While it is possible that religiosity may not be a significant explanatory variable because it is correlated with some of the other social variables already in the model, it may well be the case that higher levels of premodern values are associated with lower average levels of happiness because premodern or fundamentalist values tend to be more fear-based and intolerant of differences, as well as tending towards more authoritarian enforcement by society, religious hierarchies and even government.
