I recently came across a headline referring to a 2016 survey in Iceland which found that 0.0% of Icelanders 25 years or younger believe God created the world. My immediate impression was that this implied a zero per cent prevalence of atheism in this age group. When I read the article, I found that the relevant question gave respondents four options: the world was created in the big bang, the world was created by God, the world was created by other means, or no opinion. Outside of countries dominated by fundamentalist religious groups, most religious people would likely choose “created in the big bang”. The survey actually found that 40.5% of respondents aged 25 years and younger said they were atheist, and 42% said they were Christians.
It is certainly the case that the prevalence of atheism is higher in younger ages in the developed countries where religiosity has been declining for decades. So I thought I would take a look at the prevalence of atheism in younger adults aged 15-34 years from the Integrated Values Surveys [1-3] that took place in the last wave, in the period 2017-2020. See my earlier posts (see here and here), which examined global, regional and country-level trends in religious belief and practice, for more details on the data and definitions of atheism and religiosity categories.
Countries with the highest prevalence of atheism and non-religion in 2017-2020
The following plot shows the prevalence of religious and irreligious adults for the 31 countries with the highest irreligious prevalence (atheists plus non-religious). China and South Korea lead these countries with irreligious prevalences over 80%, followed by Sweden, Czechia, New Zealand and Japan, with prevalences in the 70’s. In terms of atheism, there are 18 countries with prevalences over 50% in the 15-34 year age group, including Australia at 53%.

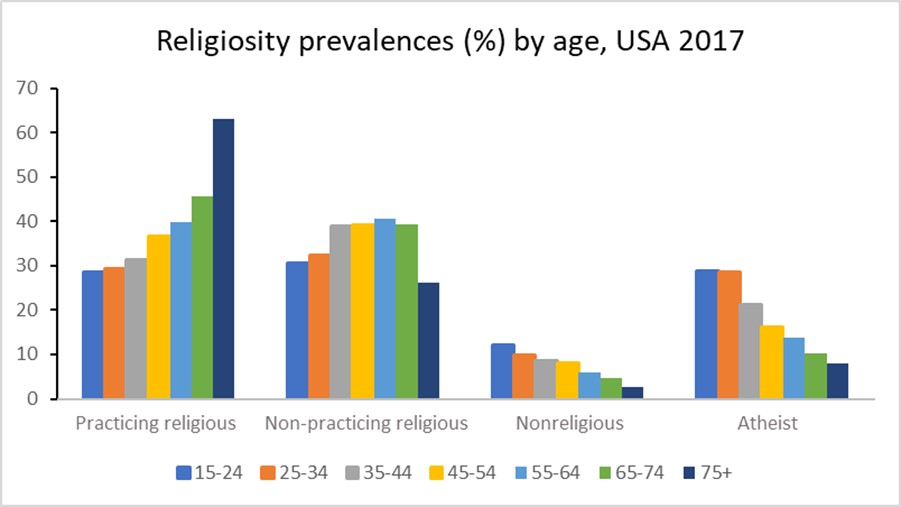
In these countries, the prevalence of practicing religious generally increases with age and the prevalence of atheists generally decreases with age. The plot for the USA 2017 survey data below illustrates this.
Are these prevalence patterns predominantly due to ageing, time period or birth cohort? Since period = birth year (cohort identifier) + age it is not possible to determine the separate effects of all three factors. Ageing as a driver of religiosity would imply that people become more religious as they get older, and this seems the least likely of the three factors to fit observed age patterns over time.
Relative contribution of cohort and period to the overall trends in religiosity
I’ve attempted to estimate the relative contributions of birth cohort and period to the evolution of religiosity in the USA using a cohort projection model. I first used the data from all waves of the US surveys to impute religiosity prevalences for years 1980, 1990, 2000, 2010, and 2020. I then projected religiosity prevalences for each age group in 2020 assuming that those prevalences remained constant at the values that age group would have had in the past when it was aged 15-24. Comparing this with the actual prevalences for 2020 allows estimation of the proportion of the change in prevalence over time that is attributable to cohort effects.
For practicing religious, non-religious and atheists, the cohort projection explains around 25% of the overall change, the other 75% is attributable to period. For the non-practicing religious, these proportions are reversed with 25% explained by period and 75% by cohort.
Projecting religiosity prevalences to 2030
My previous projections of religiosity to year 2020 were carried out using trends in all-ages-both sexes prevalences. I thought it would be interesting to explore projections at age-sex level for selected countries, given the likely variations in trends across age groups. I experimented with several statistical models including a period-cohort projection model, and a model that projected all four prevalences simultaneously, using seemingly unrelated regression techniques to constrain the prevalences to add to 100%. It proved difficult to get sensible results from these models when not tailored to specific country data. The disaggregation of survey data to 7 age groups for each sex resulted in highly variable prevalences across cells. The years for which surveys were available varied across countries in ways that made it difficult to develop generalized projection methods that were not sensitive to small number issues and outlier trends.
I eventually decided to do some quite simplistic projections for each age-sex category as follows:
- Project from last available wave to 2022 using short-term trends given by last two waves
- Project from 2022 to 2030 using longer-term trend from wave closest to year 2000 to last wave
- Adjust extreme trends to either the smaller of the short and long run trends, or to trends for neigbouring age-sex groups.
I carried out these projections for five high income countries with rising prevalence of atheism: USA, Australia, Switzerland, United Kingdom and Sweden. The following plots illustrate the observed and projected prevalences for the four religiosity categories. The dashed lines denotes the projected trend for irreligion (non-religious plus atheist).


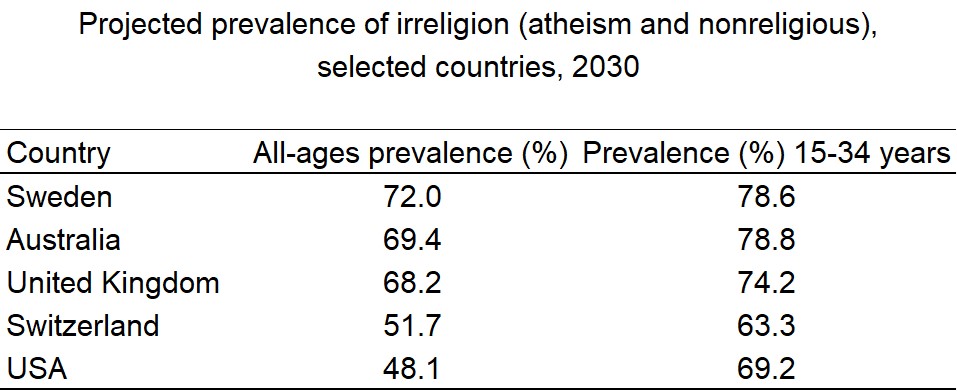
The nonreligious category includes people who state that they believe in God, but that they are non-religious and rate the importance of God as 8-10 at the not important end of a 10-point scale. In the table below, I summarize the projected prevalence of irreligion (nonreligious or atheist) in 2030 for the five countries for all ages combined and for the young adult age group 15-34 years. The irreligion prevalence is generally higher in the younger age groups, and the 2030 value gives an indication of likely future trend for all ages.
Is irreligion likely to continue increase in the future? If the economies of high income countries continue to grow, with decreasing levels of poverty, and education levels continue to improve, it is likely that religiosity in these countries will decline in the longer term. The joint global crises of global warming and the pandemic, with rising populism and rejection of global institutions and actions, may on the other hand result in economic downturns that result in a stalling or reversal of the current religiosity trends. The situation in the USA where a religious minority is actively seeking to impose its values on the entire population, and undermining the democratic system to achieve that, may likely accelerate the turning away from religion of the young adult population. The USA already has one of the fastest rates of increase of irreligion in the last decade.
References
- EVS (2021): EVS Trend File 1981-2017. GESIS Data Archive, Cologne. ZA7503 Data file Version 2.0.0, https://doi.org/10.4232/1.13736
- EVS/WVS (2021). European Values Study and World Values Survey: Joint EVS/WVS 2017-2021 Dataset (Joint EVS/WVS). JD Systems Institute & WVSA. Dataset Version 1.1.0, doi:10.14281/18241.14.
- Haerpfer, C., Inglehart, R., Moreno, A., Welzel, C., Kizilova, K., Diez-Medrano J., M. Lagos, P. Norris, E. Ponarin & B. Puranen et al. (eds.). 2021. World Values Survey Time-Series (1981-2020) Cross-National Data-Set. Madrid, Spain & Vienna, Austria: JD Systems Institute & WVSA Secretariat. Data File Version 2.0.0, doi:10.14281/18241.15.