
Its now one month since my earlier post on the coronavirus pandemic A lot has changed since then. We have gone from 24,392 deaths globally on March 26 to 206,915 on April 26th. And recent analysis of total registered deaths by week in February and March, compared to the same periods in the previous year, suggest that the reported deaths (mostly hospital deaths) are only about 70% of the actual deaths. The proportion of deaths reported in developing countries without good death registration (including most of Africa, and much of Asia) will be even lower.
I downloaded latest COVID-19 data (up to 25 April) yesterday, and initially did some curve smoothing to look at trends in daily confirmed cases and deaths, mostly to see whether the epidemic does seem to have peaked in countries now discussing easing social distancing. It struck me that it may be possible to make use of these smoothed series to do some short-run projections of deaths out for around a week, without making strong assumptions about the shape of the curve. So I did this, some example projections are below.
My key insight was that trends in mortality should reflect trends in confirmed cases around 14 days earlier (based on a quick literature review). If testing rates are stable, this should allow projection of daily deaths out to around 14 days based on the confirmed case time series. Furthermore, it should be possible to assess and project the trend in apparent case fatality rate (deaths divided by cases 14 days earlier) which will reflect the trend in testing rates and regime. So I spent a couple of hours yesterday having a go at doing this. This is not intended to be a serious attempt at prediction of short-run trends, as I’ve made some simplifying assumptions and picked a curve smoothing technique that was to hand, but not probably ideal. But I will compare reality in a week’s time with my projections, just for the heck of it.
Here are the results for Australia, Switzerland, Italy, USA, UK. The plots show new confirmed daily cases and deaths. My professional blog has some more results and description of the simplistic model at covid-19-short-run-projections.

Switzerland shows clear evidence that the epidemic peaked in late March to early April and is in decline. The dots are reported new confirmed cases each day, and reported deaths each day.
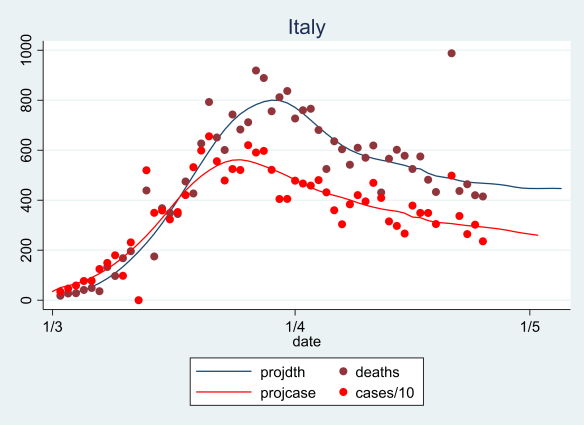
Clearly a continuing decline for Italy, though projected deaths are nearly flat. Again, reality will hopefully do better.
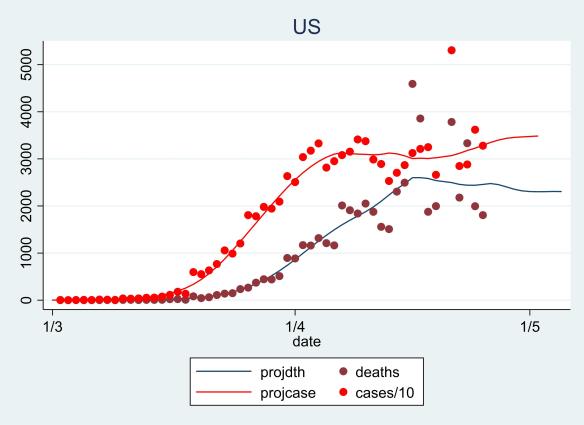
The US projections are for continuing increasing daily cases, and for slight decline in daily deaths, probably partly reflecting increasing levels of testing. These projections are probably not that meaningful, as the US has epidemics occurring with different timing in various States, and State level modelling would probably give more nuanced results.

Its unclear from this graph whether daily cases have plateaued, but a projected declining case fatality rate associated with increasing levels of testing has resulted in a projected decline in daily deaths. It will be interesting to see whether reality does better than this.
