
Today Switzerland became the country with the highest rate of confirmed cases of corona virus per million population. Well, that is if you ignore some micro-populations such as the Vatican City, San Marino, Andorra and Faeroe Islands. Why? It is landlocked with Italy, France and Germany around it. It did not close the border between Ticino and Italy for cross-border workers and many live in Italy were the virus spread rapidly. Also, it was the height of the ski season and alpine resorts were crowded with skiers from all over Europe, Britain and beyond. Here is a graph I did yesterday comparing confirmed cases per million population for the thirty leading countries (excluding small countries with population less than one million. Data are from worldometers.com at 13.11 GMT on March 24. A this point Switzerland had not yet overtaken Italy.
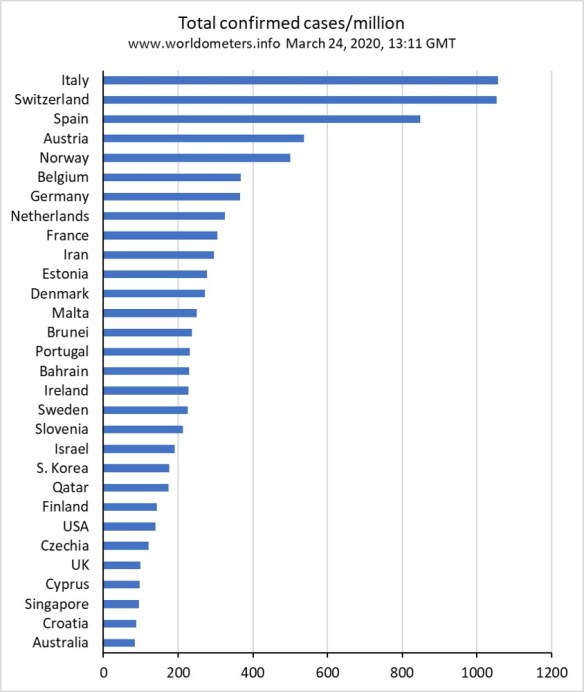
The true number of cases will be much higher for most countries, depending on level of testing and availability/access to testing. And data for countries is being updated daily but at different times of day for various countries. The numbers on worldometers.com are quite similar to those on theJohns Hopkins website but seem to be updated slightly earlier and so are usually a little higher.
There is also a nice new site http://91-divoc.com/pages/covid-visualization/ that plots time trends in cases and deaths, total numbers and rates per million population. The time axis is days since 100+ cases/deaths or days since 1 case/death per million population. I’ve included screenshots below of cases/million and deaths/million with Switzerland highlighted. The dotted straight line on the log scale represents a daily growth rate of 1.35 (35% more cases than day before). That corresponds to a doubling time of 2.31 days. Fortunately, most curves are showing some flattening after the first 10 days. Australia has a curve that corresponds to a daily growth rate of 1.2. That difference is huge. At a daily growth rate of 1.35, the first case becomes 3.2 million after 50 days, whereas at 1.2 it becomes 9,100.
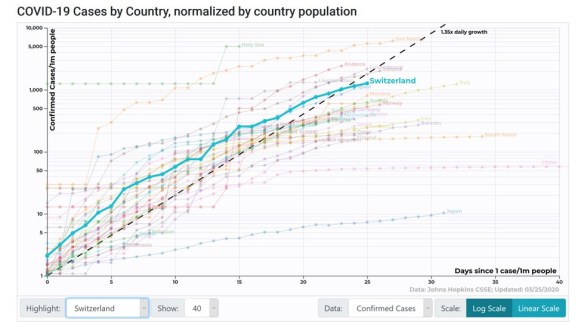
The USA is on day 20 since 100 confirmed cases (or day 18 since 1 case/million) and is following the 1.35x line very closely so far. Unlike most other countries this far into the epidemic, it is not yet showing signs of slowing down. US total confirmed cases will likely overtake those of Italy and China by tomorrow or day after.
If you hover over a point on one of the country curves in the graphs on this site, you get growth rates for last day, week, 16 days. You can convert growth rate g (eg. 1.35) to doubling time in days by calculating log(2)/log(g) and the increase in total cases over d days as g to the power d. Of course, these growth rates cannot continue unchanged. Either people will change their behaviour to socially isolate and more, if the bodies start piling up as happened in Italy, or the level of herd immunity will rise to the extent that the number of new infections caused by an infected person will drop lower. And that latter scenario will come with lots of deaths as well, particularly when health systems become overwhelmed.

Here in Geneva, we are on day 10 of social isolation. Staying home unless necessary to work, or buy food, or other essential activities. No gathering of more than 5 people. Borders are now closed to all except cross-border workers and essential trips. Most border crossings are completely shut, and the three that are open are checking papers for every person and there are waits of hours to get across. All shops, gyms, restaurants, entertainment, ski resorts closed with the exception of food stores, petrol and pharmacies. Hairdressers are closed, unlike in Australia where they are considered essential for morale. I am also on day 7 of doing Wim Hof breathing. Who knows, it might even pep up my immune system.

Pingback: COVID-19 short-run projections | Mountains and rivers