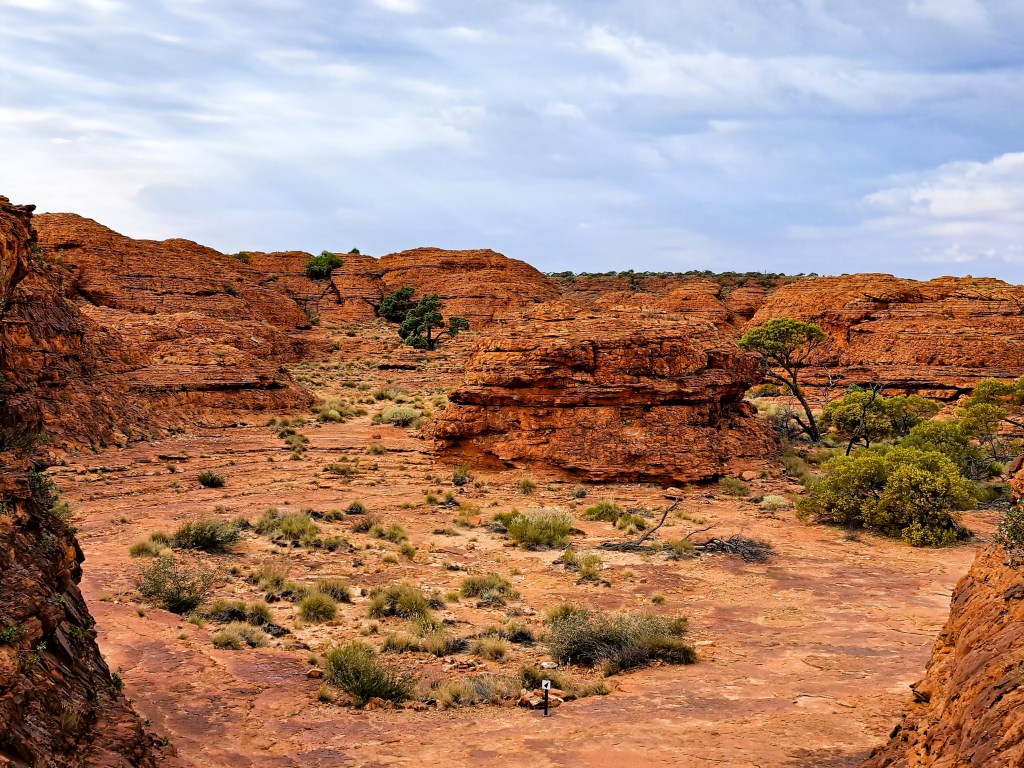
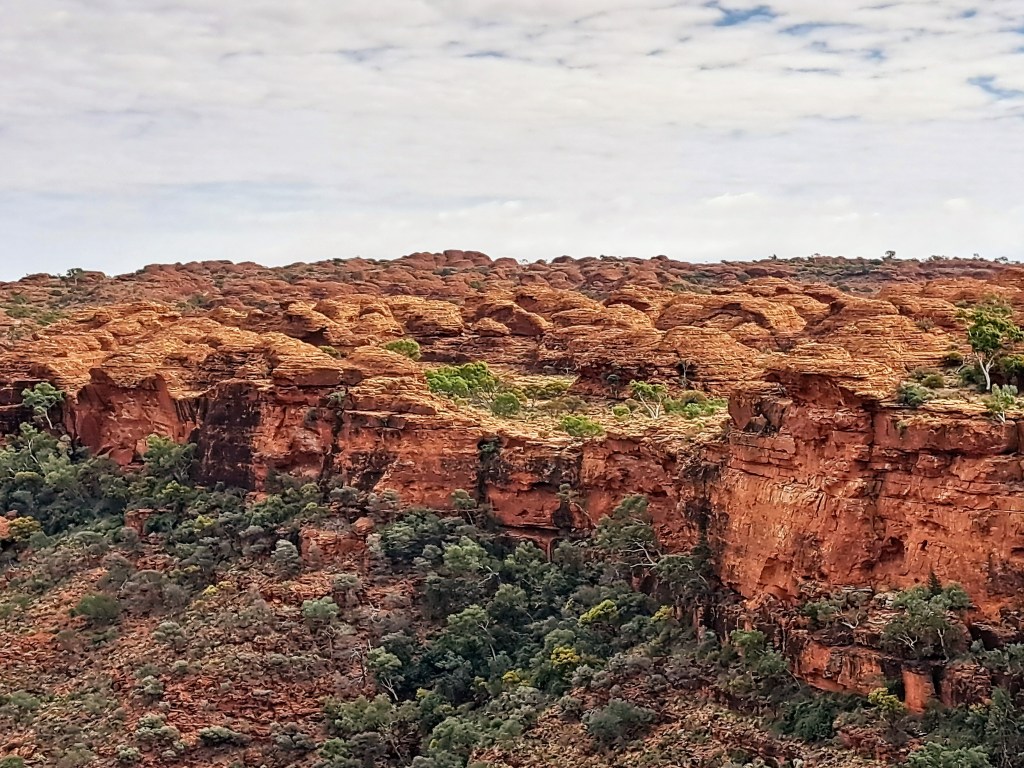
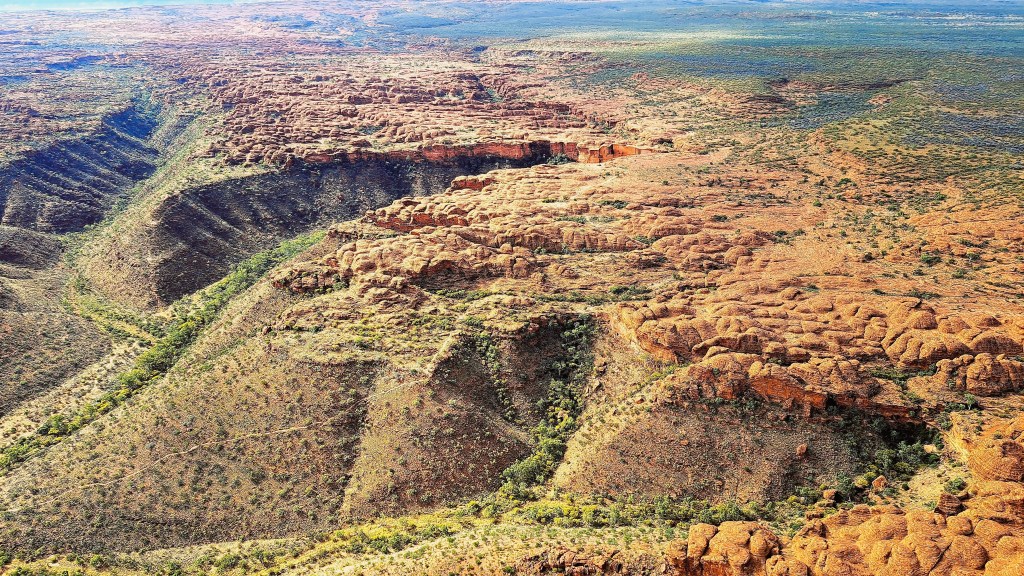
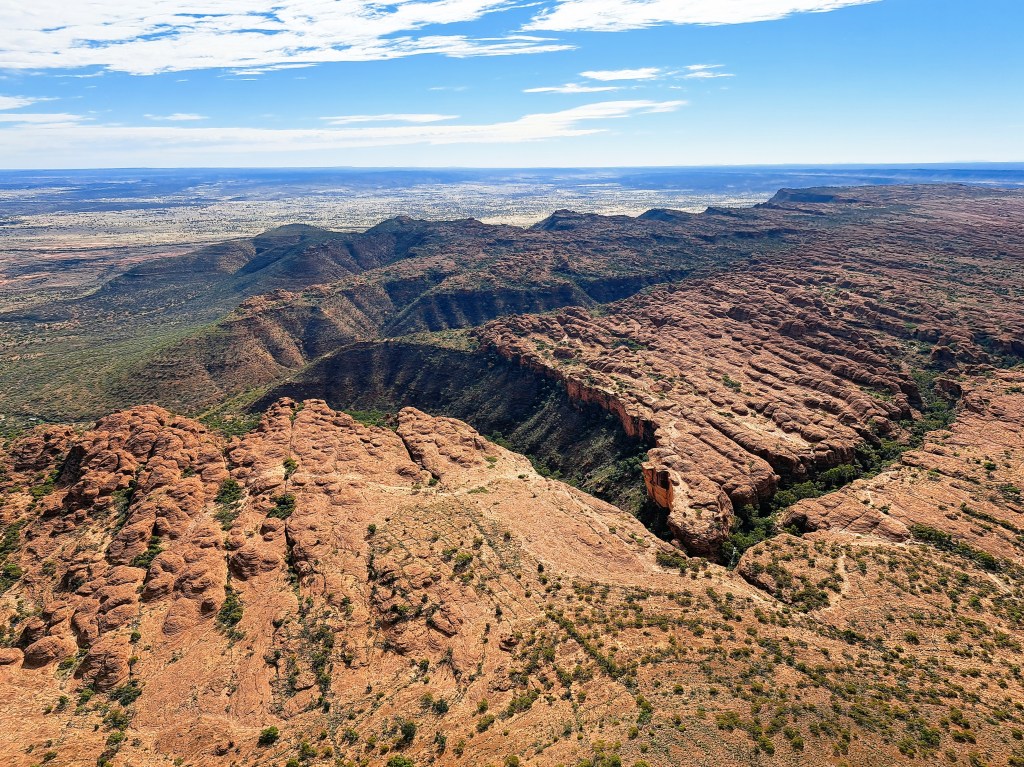
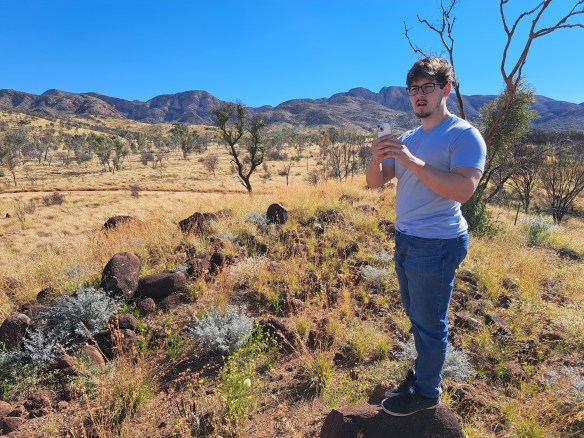
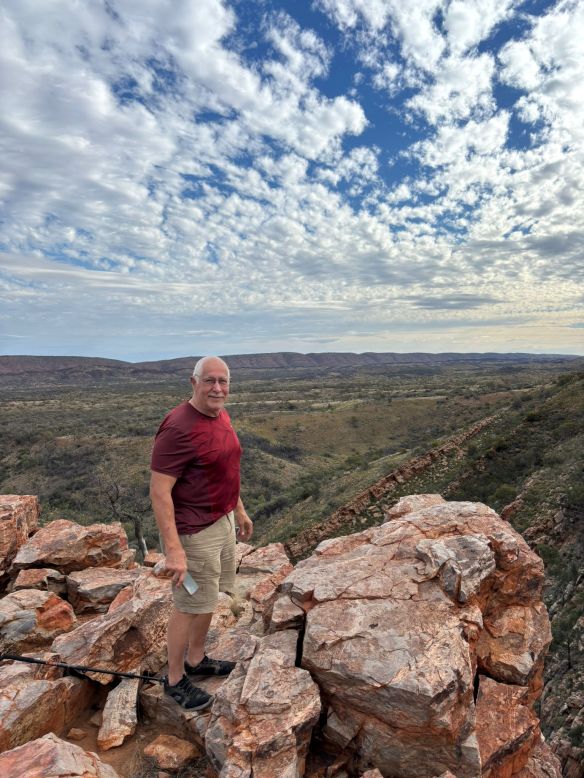
In the last two weeks of July 2025, I took my younger son to central Australia to visit for his first the iconic desert landscape and to explore some of the spectacular desert and mountain scenery. I have visited central Australia a number of times when I was younger, with trips to Alice Springs and Uluru (Ayers Rock), Katherine Gorge and the Arnhem Land Escarpment.
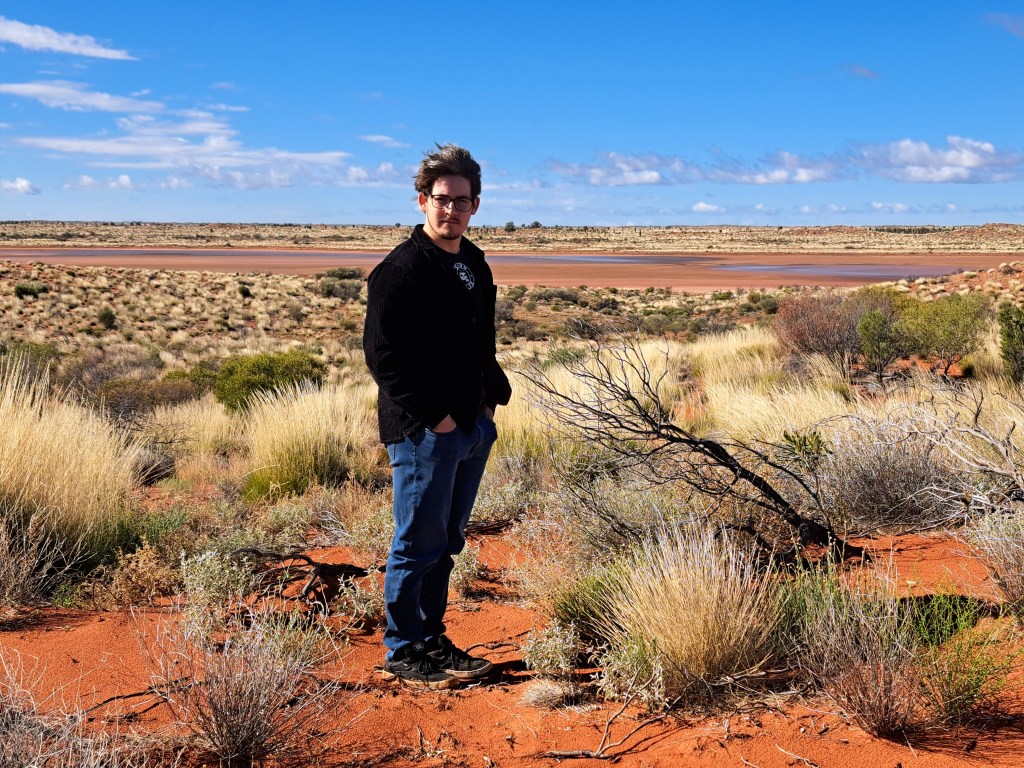
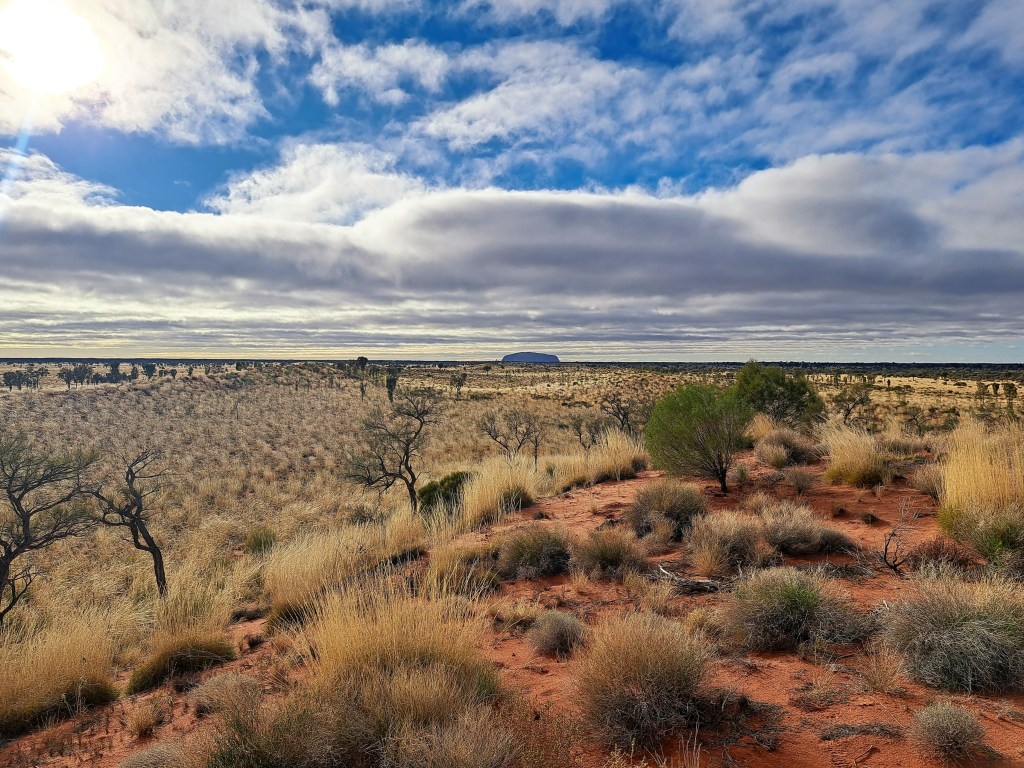
I have included links to previous posts about this trip and the end of this article. From Kings Canyon, we drove 330 km southwest to Uluru, formerly known as Ayers Rock, and perhaps the most famous landmark in Australia. As we headed towards Uluru, the land became extremely flat. The recent rain from the storm during the last night we were in Kings Canyon was widespread and had filled some of the shallow lakes that usually form only in the wet season.
We stayed at a tourist hotel in Yulara, a new settlement about 20 km from Uluru, built specifically to provide tourist accommodation and services, including an airport.
This was my second visit to Uluru. The first was 45 years ago, one week before the dingo took Azaria in August 1980. That was also a memorable trip. One of my friends had found a pilot seeking to increase his flying hours, who was willing to fly the four of us from Sydney to Uluru in a light plane, all for the cost of the fuel. I think we paid a couple of hundred dollars each.
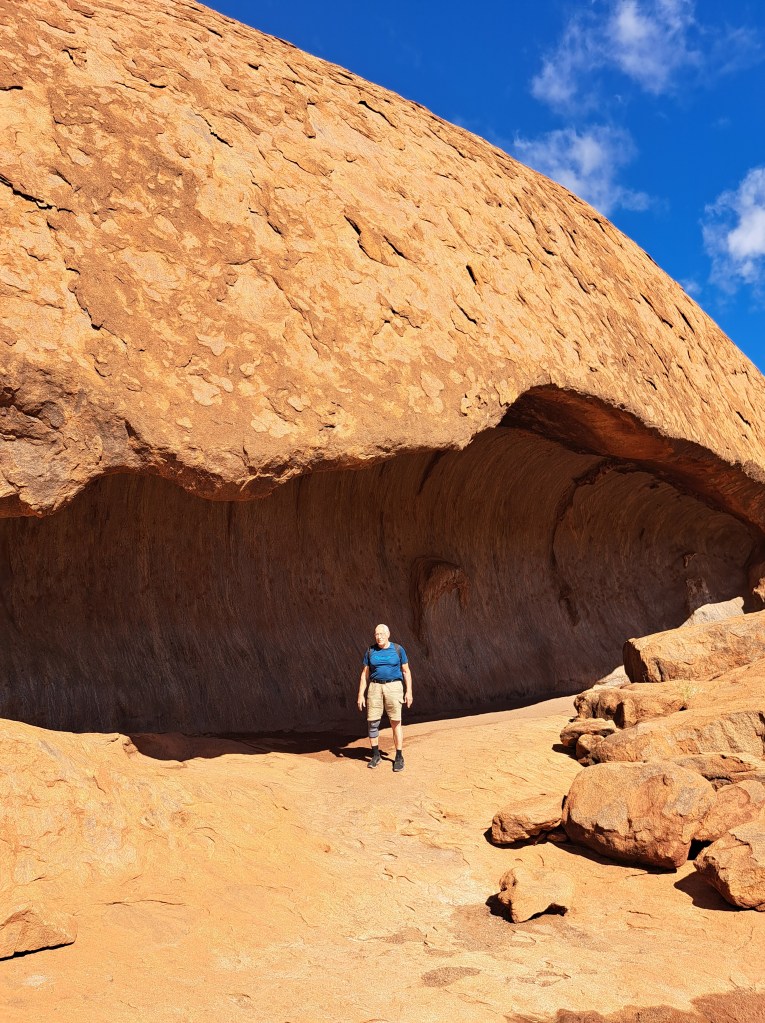
On that first trip, we slept in a cave at the base of Uluru, and the pilot slept under the wing of the aircraft. In those days, it was still possible to climb Uluru, and I climbed it before dawn the next day, to arrive at the summit just before sunrise and to see the shadow of Uluru stretching all the way to the horizon when the sun rose. My three friends were all rock climbers and had decided to do a free solo of Uluru on its other side. I waited on top till they arrived quite some time later, and they looked quite traumatized. It seems the gully they had chosen to climb ended on a steep face which was extremely exposed and pushed my friends well out of their comfort zone.
A brief anecdote. When first writing some notes about my first trip to Ayers Rock, I could not remember exactly which year the trip was, but I knew we were there the weekend before the dingo took the baby Azaria Chamberlain. The baby’s mother Lindy Chamberlain was convicted of murdering the baby, and spent three years in prison before the baby’s clothing was found in a dingo den, and she was exonerated. So I looked up this event on Wikipedia to check the date it occurred, and read the article. In the last paragraph it reported that Lindy and Michael Chamberlain had divorced after these event, Lindy remarried an American who lived in Australia, and the dingo changed its name to Sally and was adopted by a family in Florida. I went back to the article a few days later to get a screenshot for posterity, but unfortunately and eagle-eyed editor had removed the information on the dingo.
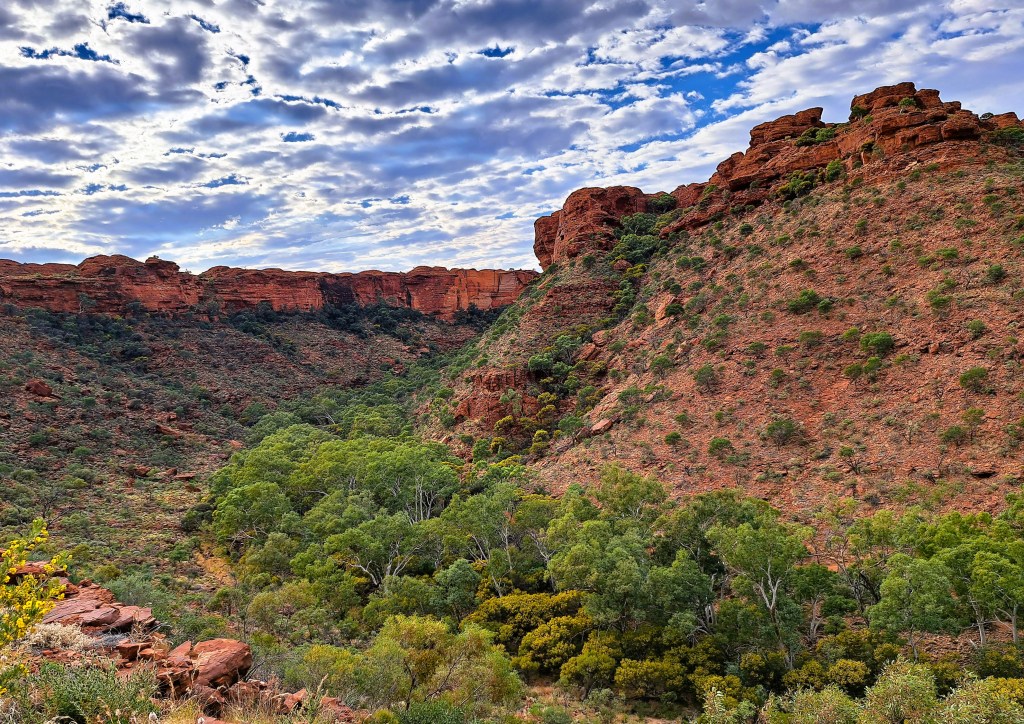
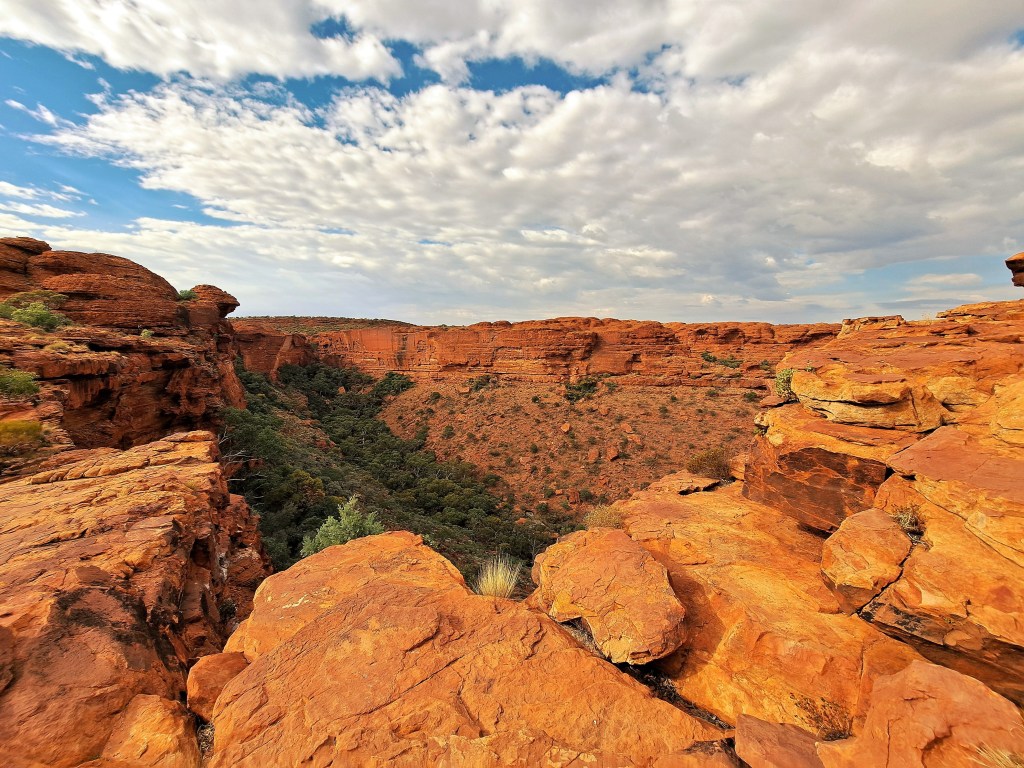
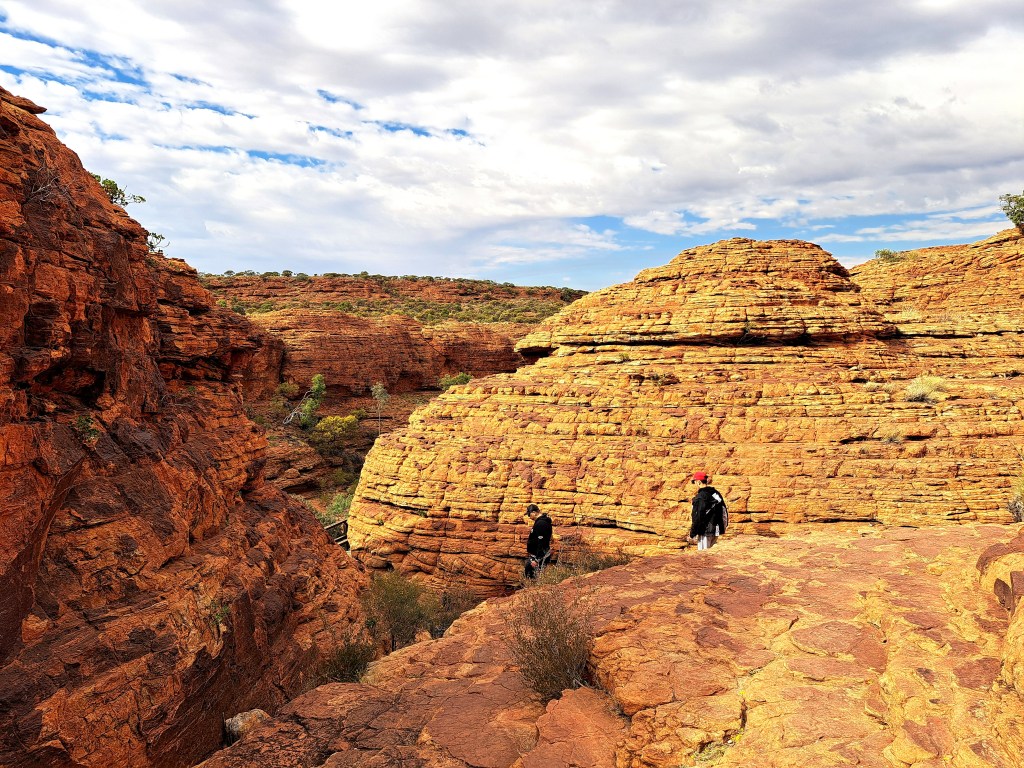
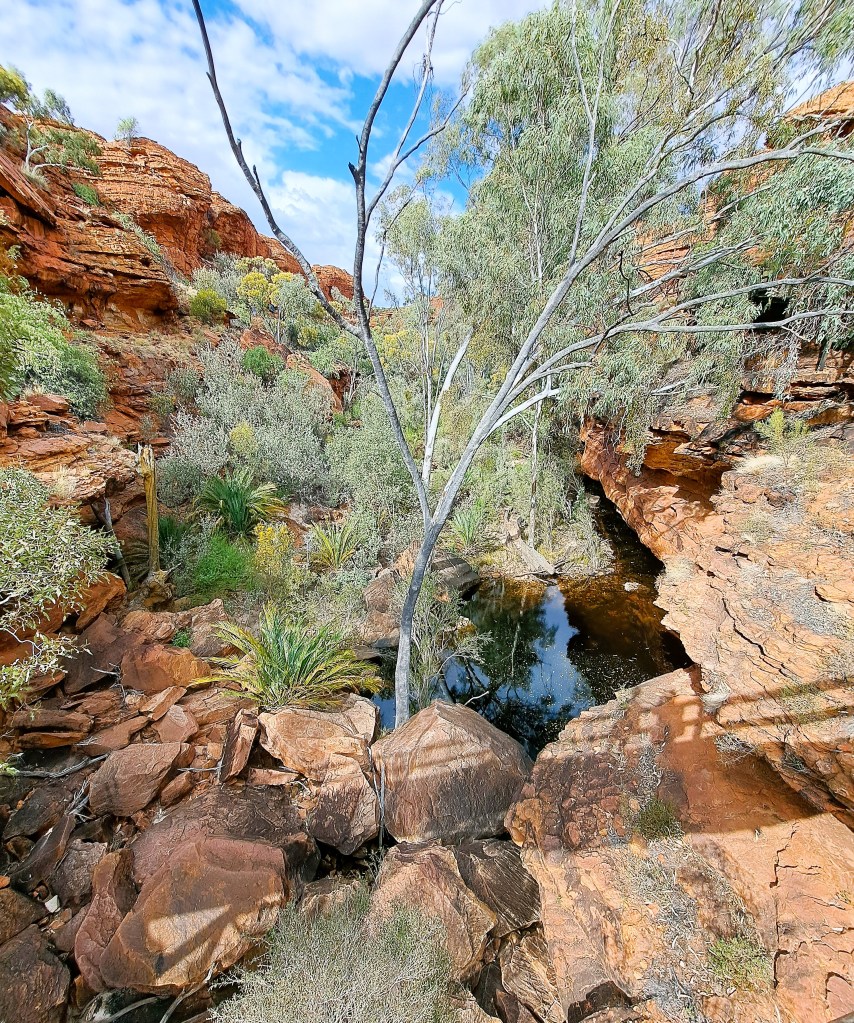
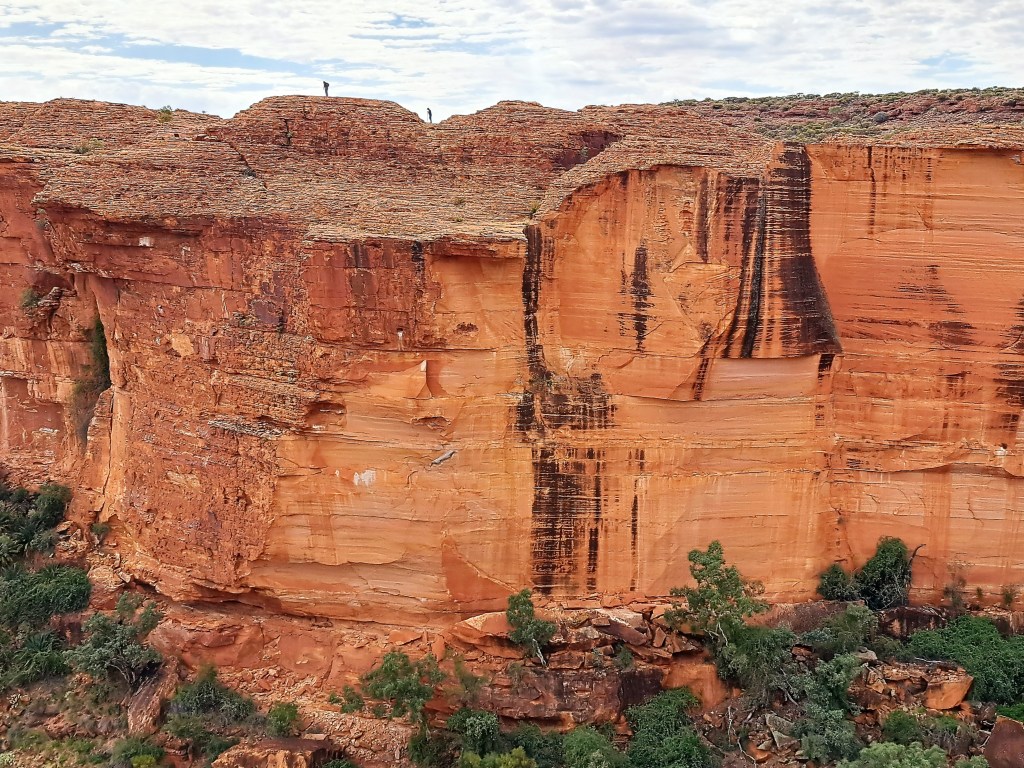
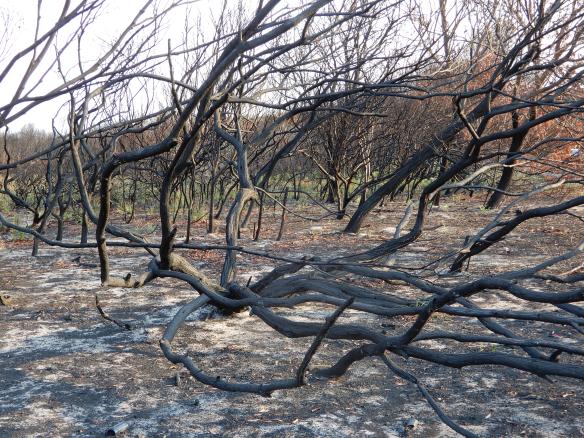
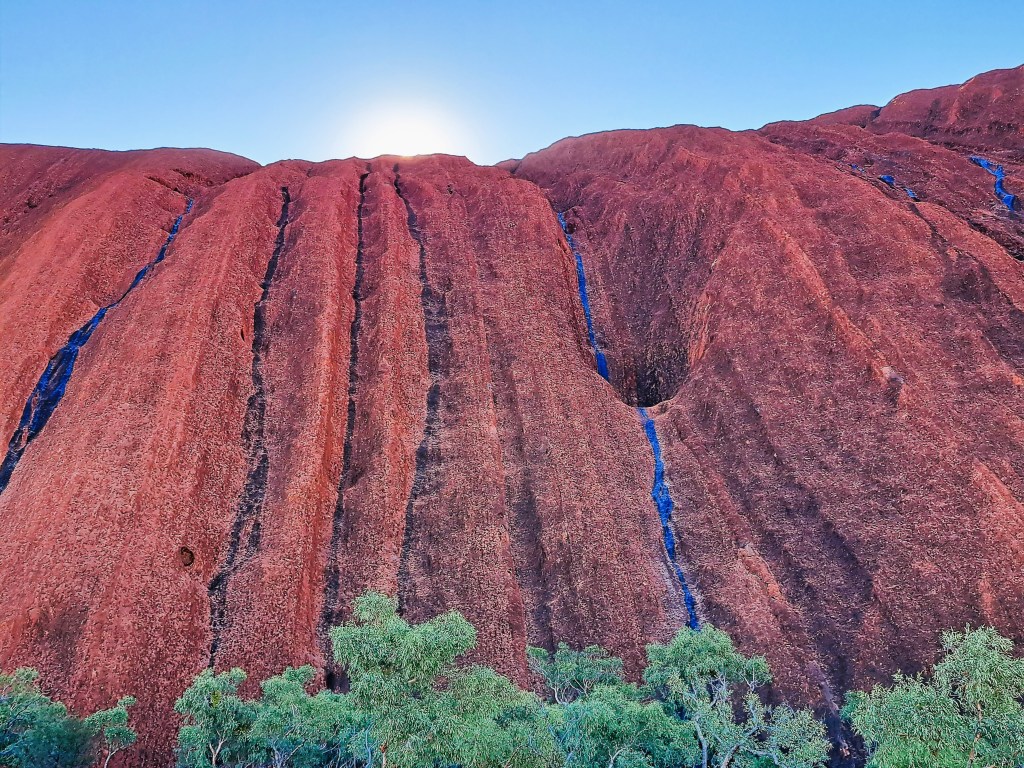
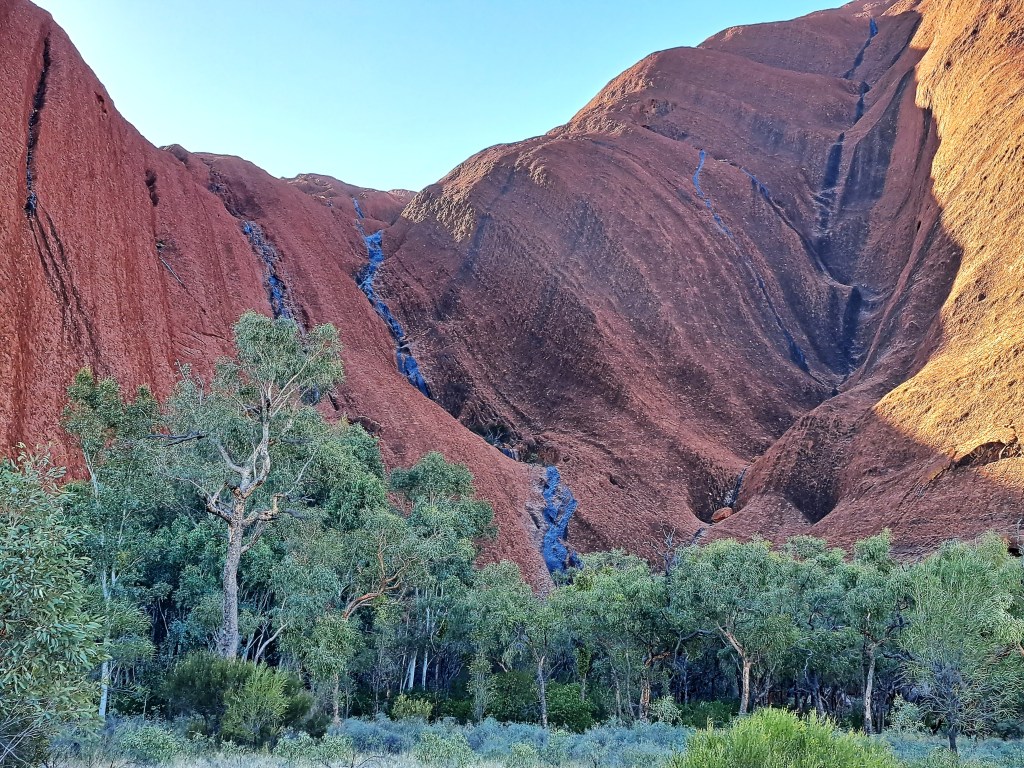
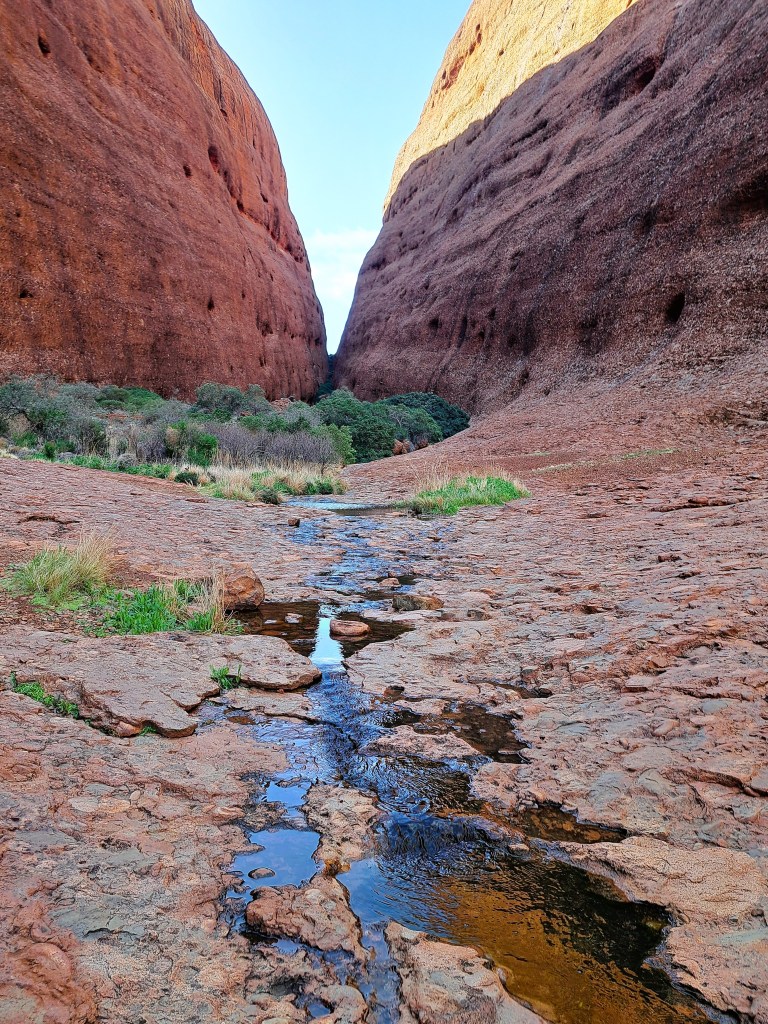
Our last night in Kings Canyon, there was a violent storm with strong wind and heavy rain. As a result there were waterfalls all over the Rock, apparently a rare sight in the dry season.
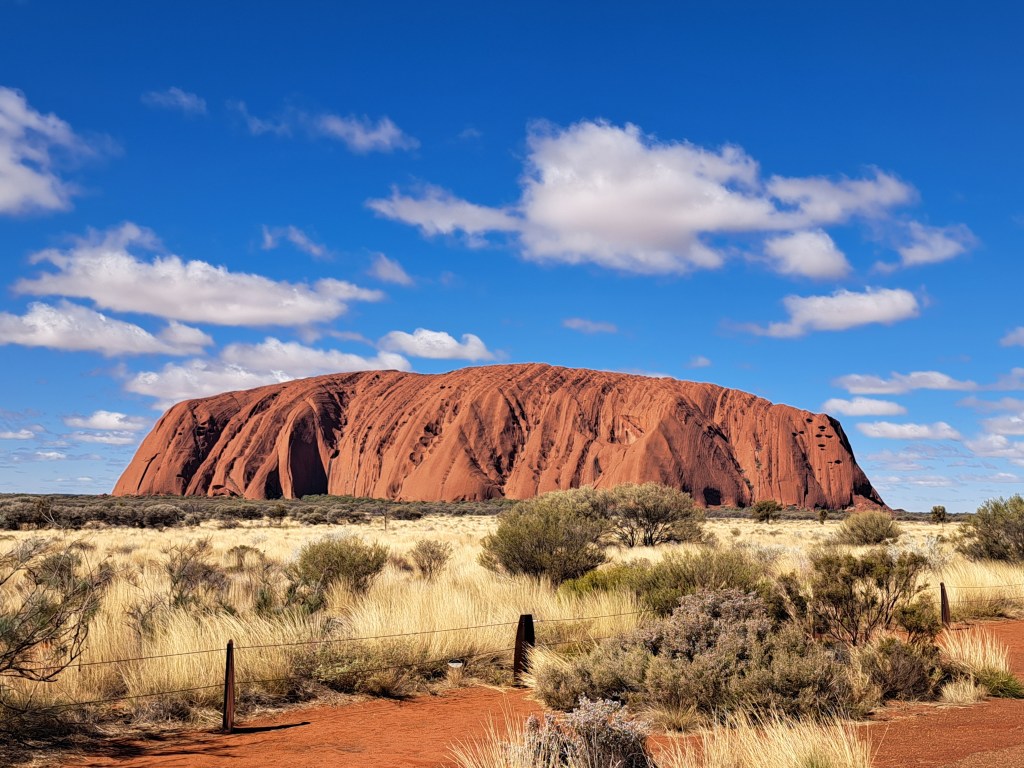
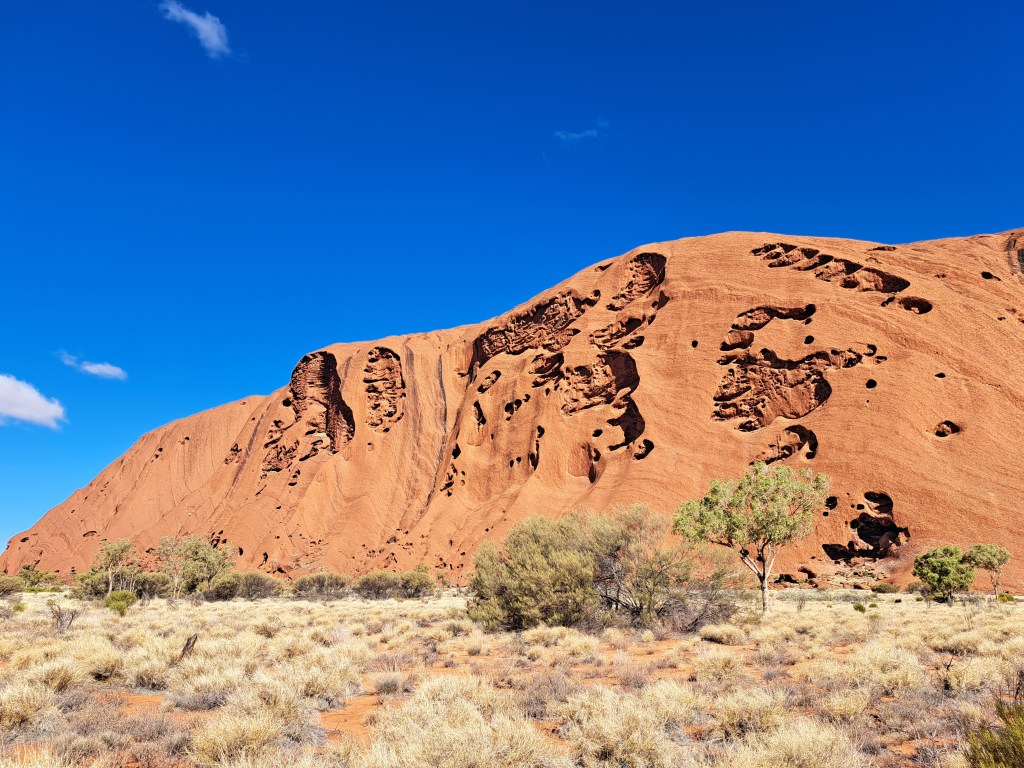
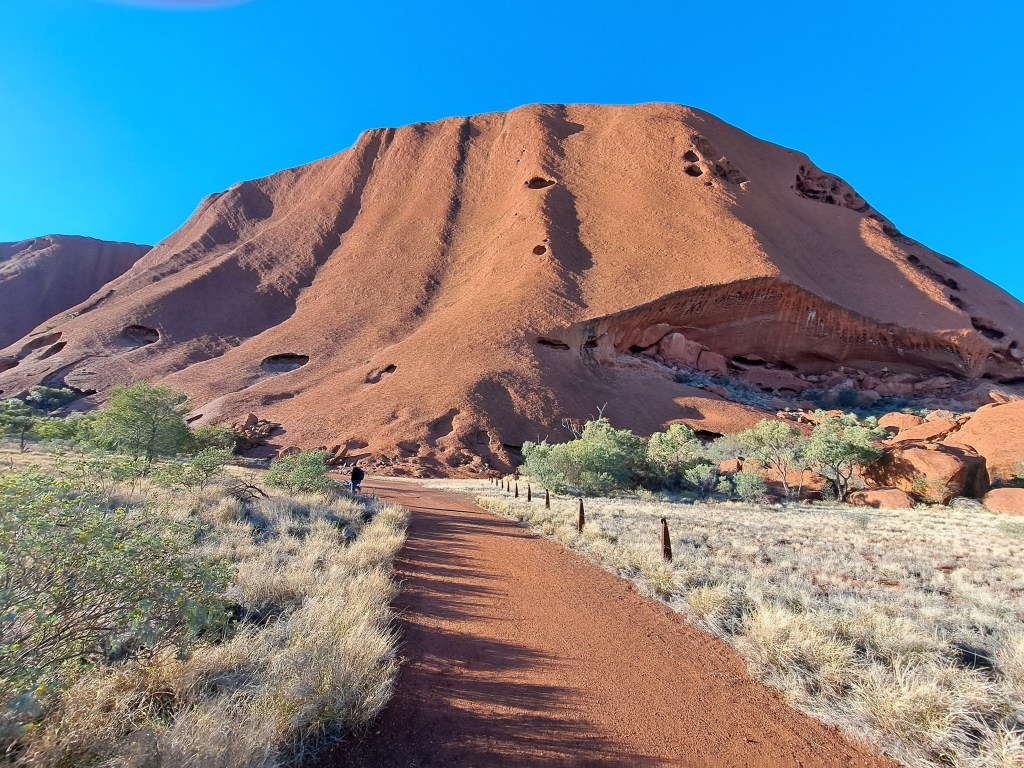
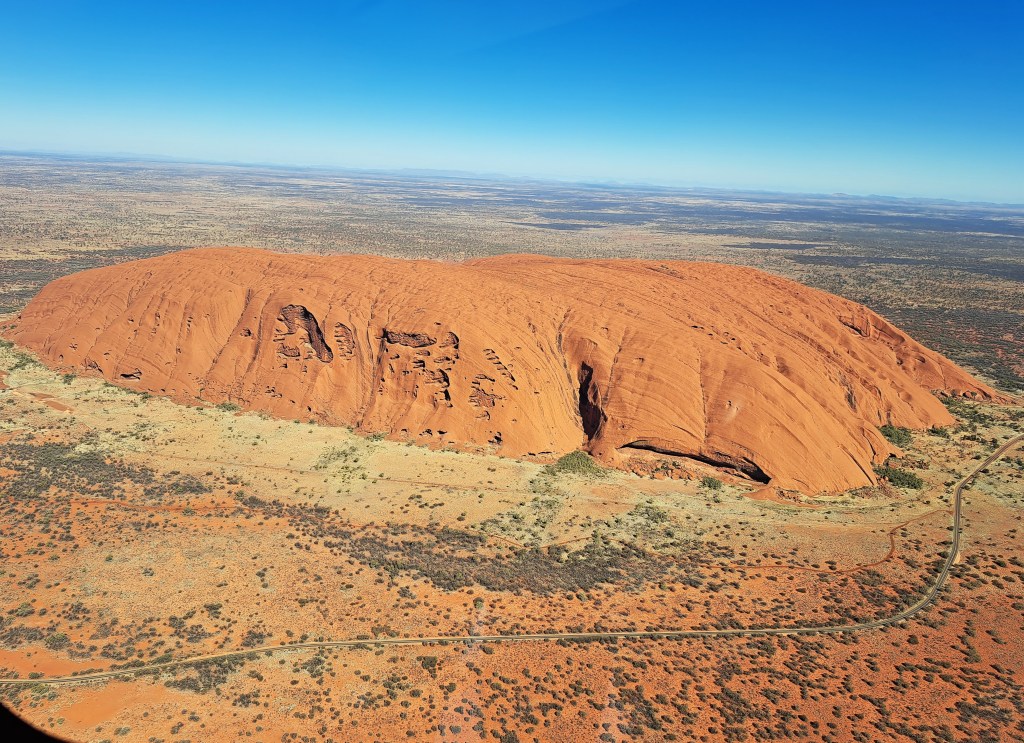
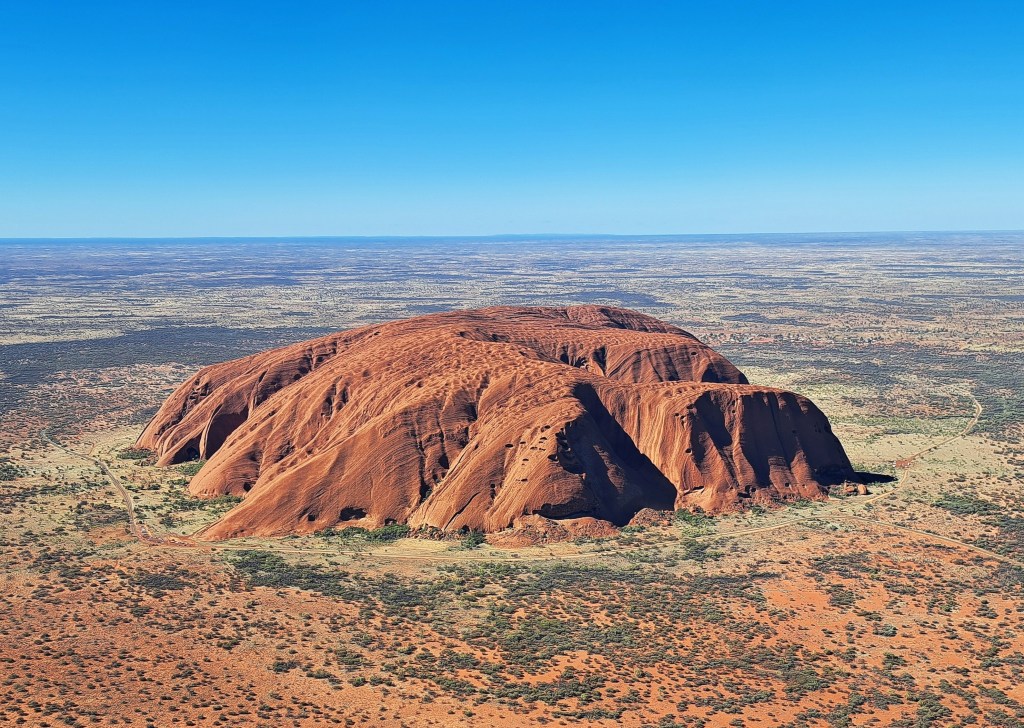
Climbing the Rock was banned in 2019. The track to the summit is still visible as a white line up the ridge that reaches the summit immediately above Felix. Back in 1980, I climbed Uluru via this route.The route was extremely steep towards the top, and there was a chain railing that climbers could use to prevent themselves slipping and falling. At least 37 people died while attempting to climb Uluru (Ayers Rock) since record-keeping began in the 1950s.
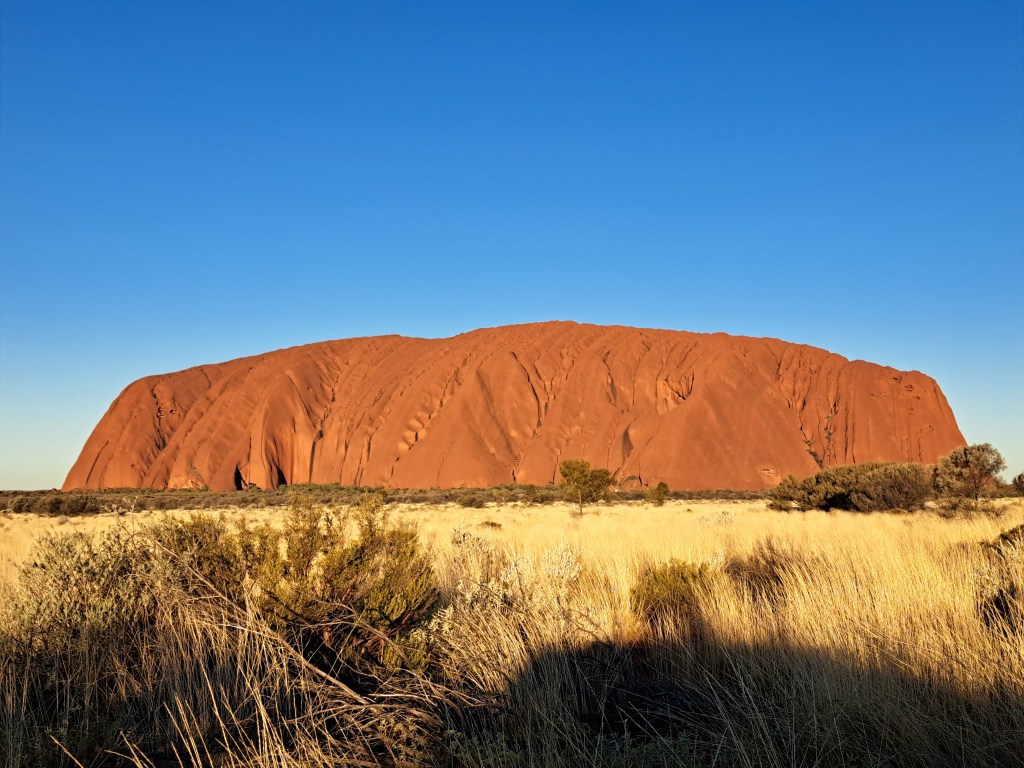
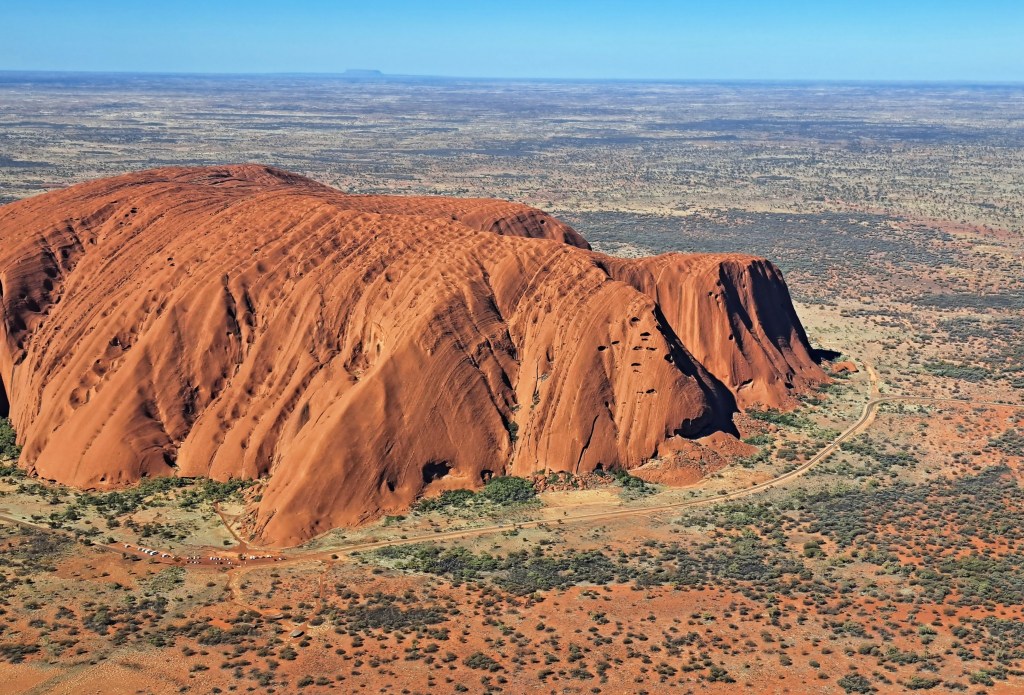
As we headed back to Yulara, the sun was getting low in the sky and turning the Rock red.
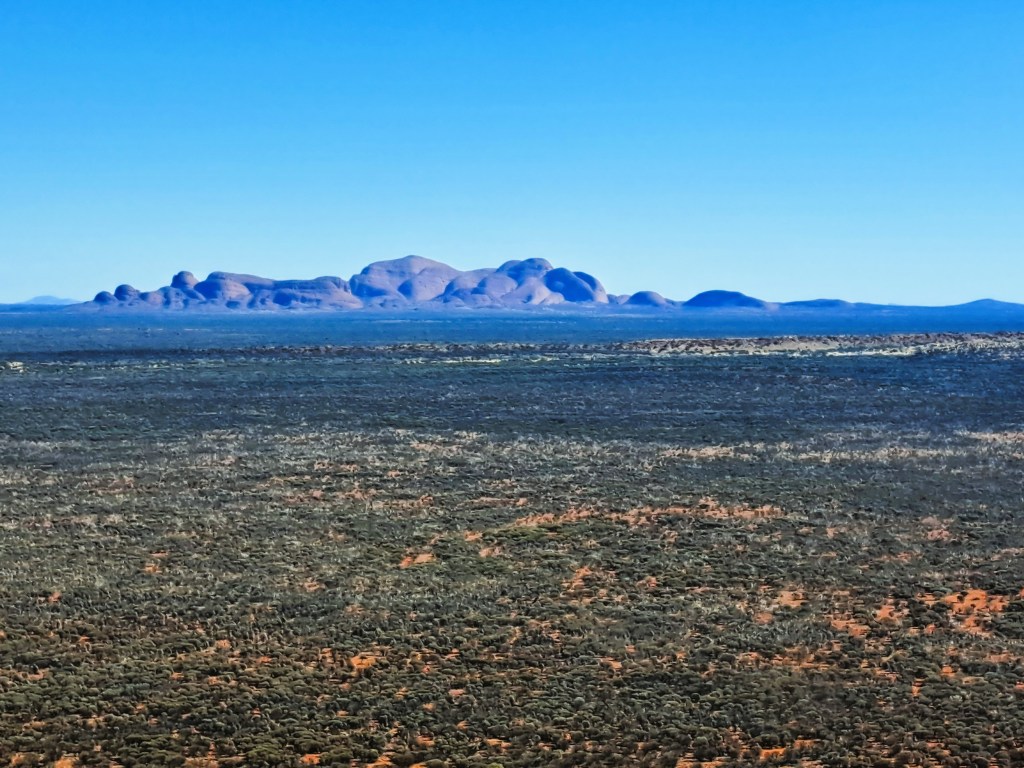
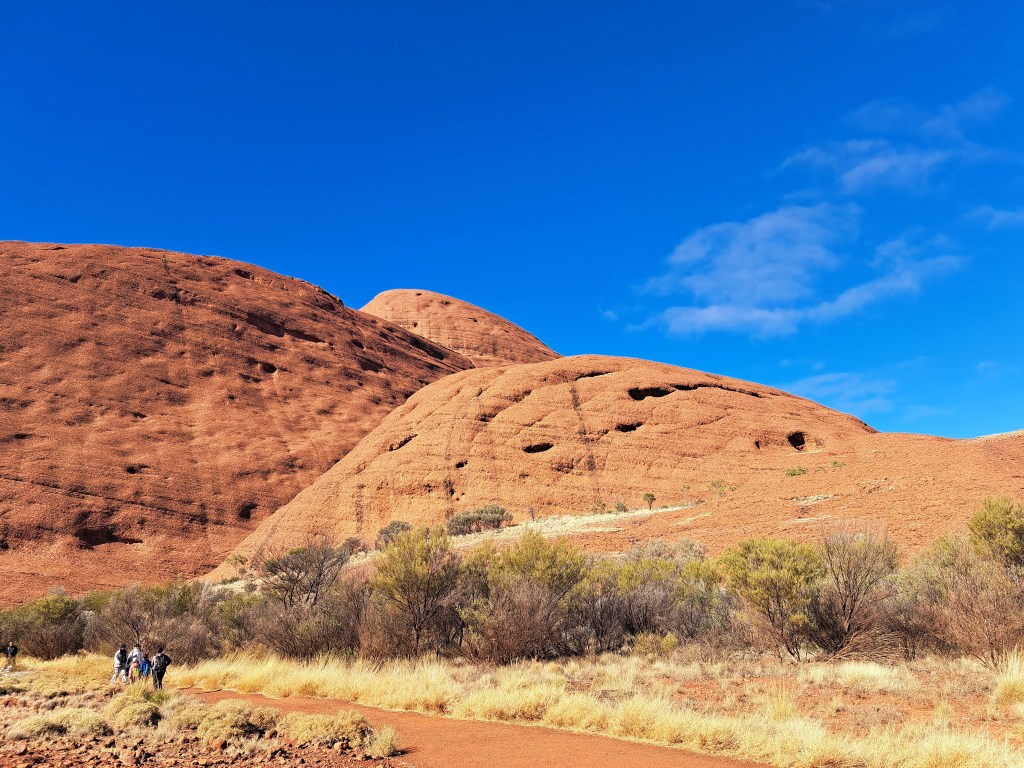
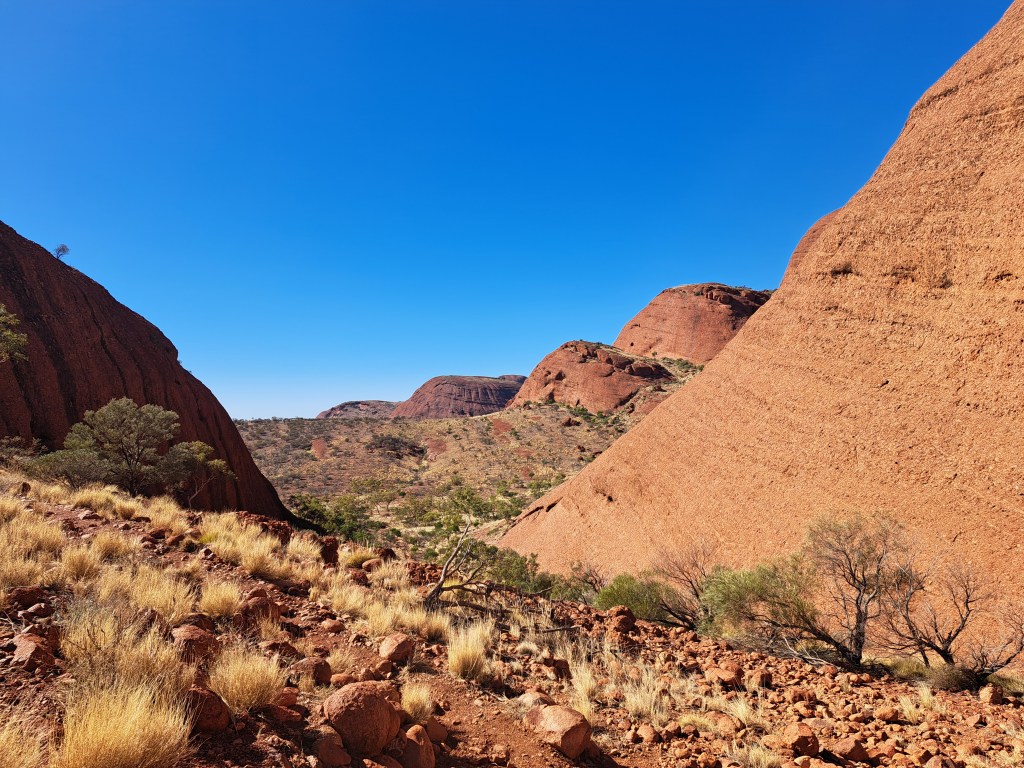
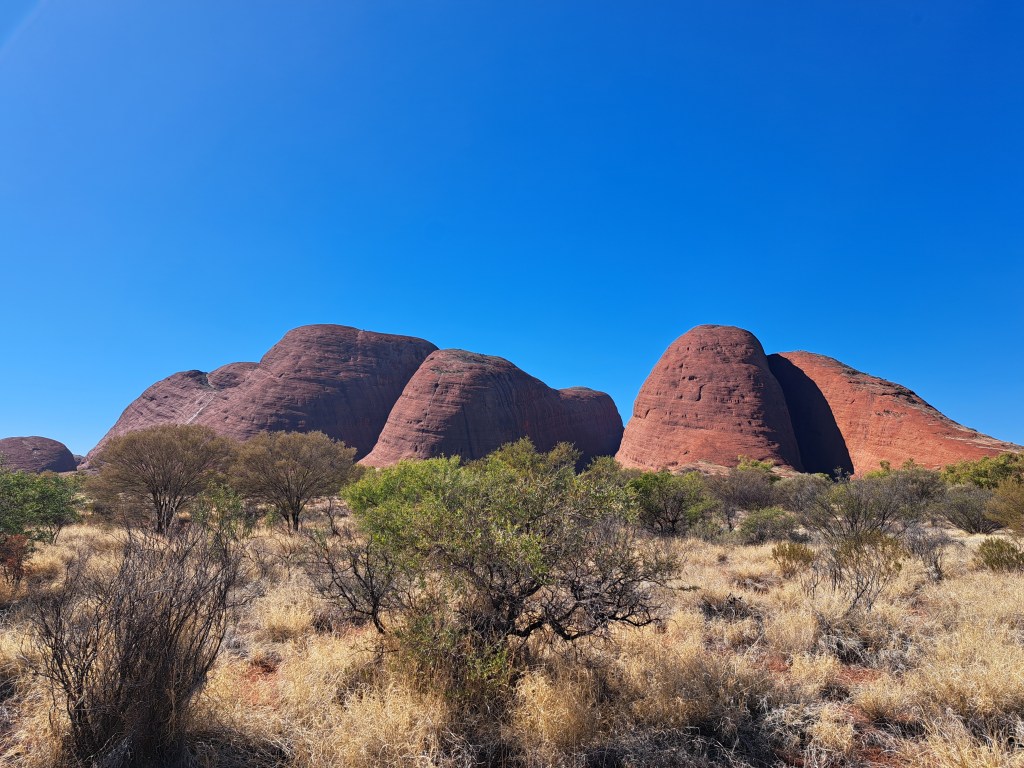
The next day we went out to Kata Tjuṯa (the Olgas), 56 km west of Uluru. This was my first land visit to them. On my first trip in 1980, the pilot had flown us out to the Olgas and we flew low over them getting superb views. I’m quite comfortable with the Aboriginal name for Ayers Rock, but I must admit I have trouble getting Kata Tjuta into my memory banks, and still think of these iconic rocks as the Olgas.
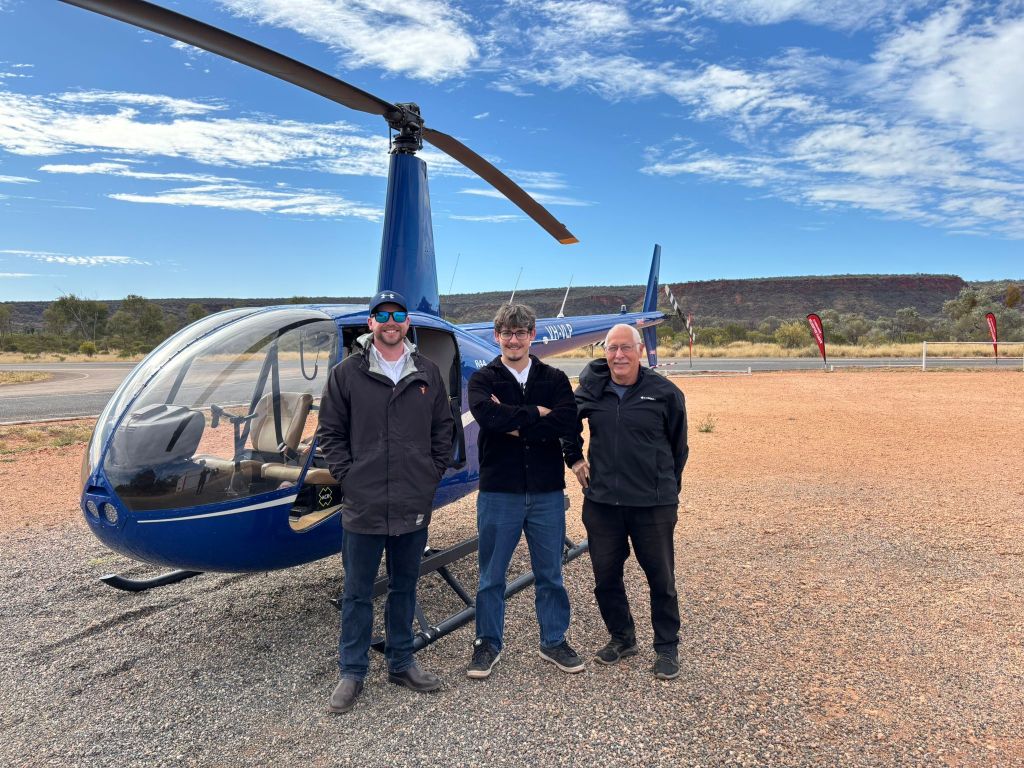
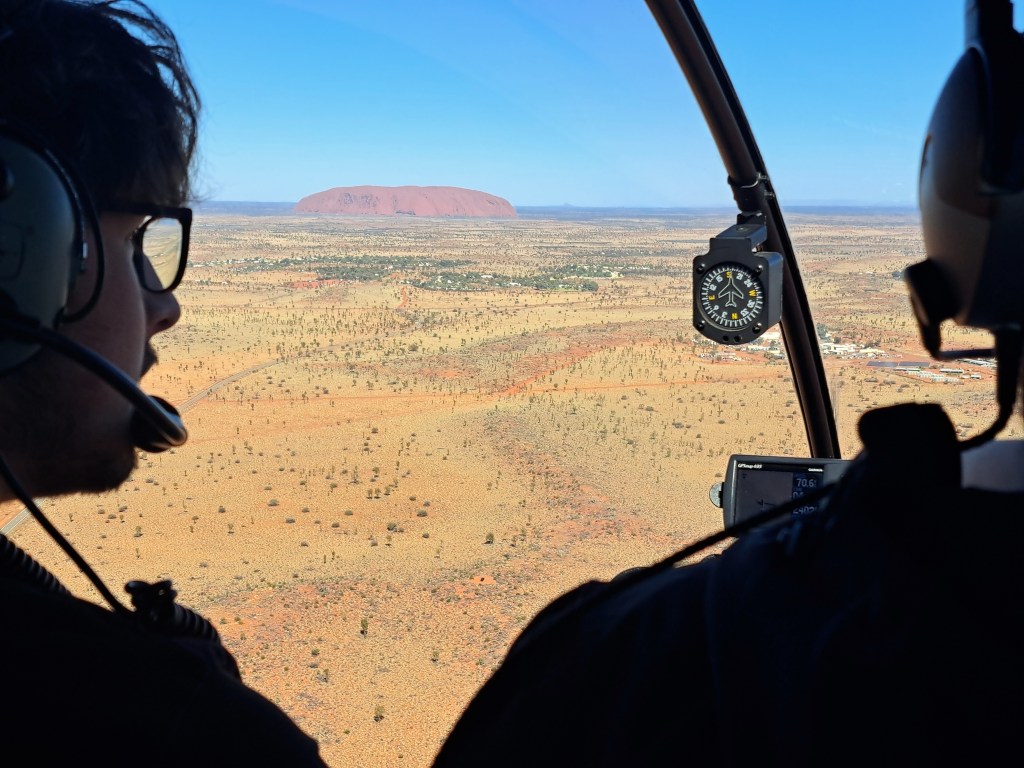
Seeing as we could not climb Uluru, we decided to do another short helicopter flight over it.
The next day we drove from Uluru to Darwin, a 500 km trip. And spent two days in Darwin, a fascinating city well worth visiting. In the 1990s, I had been collaborating with the Northern Territory Health Department on a joint project and visited Darwin a number of times, so already was quite familiar with it. However, these two days we were able to delve into the history of Darwin, and particularly its experience of being attacked by the Japanese during World War II. Perhaps I will do another post on that sometime.
Here are links to earlier posts on our explorations of central Australia in 2025.
A visit to Kings Canyon in central Australia Part 2