The world is witnessing a coup taking place in the USA as Trump and Musk set about dismantling the US government, ignoring all congressional legislation and fiscal authority. The Constitution has effectively been suspended. Trump and Musk are leading extra-governmental operatives (young white male engineers employed by Musk) who have seized control of the Treasury payment system, and IT systems in other agencies such as USAID. They are starting to eliminate agencies created by Congress, the first being USAID. They are suspending payments authorized by law, re-interpreting the Constitution, and ignoring the judiciary. Already, several judges have made orders suspending various of their activities. They are being ignored. Ultimately, much later, such orders may end up in the Supreme Court who have already ruled that Trump has immunity for official actions.
What has led to this? How did the world’s richest man and a deeply ignorant psychopathic criminal get to seize control of government in the USA?
I recently encountered a discussion about which countries are the most and least religious. This post presents some comprehensive results for the year 2020 based on my earlier analyses of global, regional and country-level trends in religious belief and practice, and the prevalence of atheism (see earlier posts here, here, and here). These analyses used data for 110 countries from the World Values Survey (WVS) and the European Values Study (EVS), covering the period 1981 to 2020 [1-3]. In previous analyses, I defined four religiosity categories as follows:
Practicing religious person: A religious person who believes in God* and is practicing**, OR a non-religious person who believes in God, is practicing, and rates the importance of God in the top 5 points of a 10 points scale.
Non-practicing religious person: A religious person who believes in God and is non-practicing OR a non-religious person who believes in God, is non-practicing, and rates the importance of God in the top 6 points.
Non-religious: A non-religious person who believes in God but rates the importance of God as any of three points at the not important end of a 10-point scale.
Atheist: A “confirmed atheist” and/or does not believe in God
Respondents were classified as “practicing” if they attend religious services or pray to God outside of religious services at least once a month. I assigned all people who do not believe in God to the atheist category. This will include some religious people who practice non-theist religions such as Buddhism.
For this post, I decided to move the atheists who said they practiced religion at least once a month to the “practicing religious person” category. In most of the regions where the prevalence of atheism was high, the percent of atheists who are practicing religious is small, at most a few percent. Its likely these are regions where there is no stigma or danger in being atheist, and the few percent practicing are likely attending religious services with other family members who are religious. In regions where the prevalence of atheism is very low, the proportion of atheists who attend religious services is generally much higher (30-40%), almost certainly reflecting stigma and danger in being openly atheist.
I moved the proportion of atheists who are practicing religious to the practicing religious category for the maps below. This adjustment makes little difference to the results. The first map shows the global variations in the proportion of country populations who are practicing religious.
Benjamin Cain recently posted an article on Medium.com, The Trump Cult and the Albatross Around America’s Neck, in which he argued that the Trump cult is fueled by southern racism, religious fundamentalism, and a backlash against modernity. He claims that “In this respect, half of the US is closer to the anti-modern Islamist states than to ultra-secular Europe.”
I realized that my recent analyses of levels of pre-modern beliefs in over 100 countries included in the Integrated Values Survey (IVS) (see here and here) could be extended to check this claim. The IVS is the combined data from the World Values Survey and the European Values Study, which have carried out seven waves of surveys in over 100 countries, spanning the period 1981 to 2021.
To examine variations in pre-modern versus modern values across countries and time, I estimated a continuous latent variable “modernity” based on responses to 11 selected questions in the IVS (see following box) whose responses will vary depending on how modern or pre-modern the respondent’s values are. which assumed there is an unobserved underlying continuous variable that describes the individual’s level of modernity of values and predicts (or correlates with) their answers to specific values questions. I used general linear modelling methods to estimate a continuous latent variable “modernity” from the responses to the 11 selected values questions. See here for more details.
I recently came across the 2017 Pew Research Center survey of more than 4,700 U.S. adults which found that of those who say they believe in God, 30% say they believe in some other higher power or spiritual force in the universe rather than the God of the Bible. Among those who say they do not believe in God (aka atheists), 47% say they believe in some other higher power or spiritual force. What do people mean when they say this? And do atheists and theists mean the same or different things?
Before discussing this, I first present some similar data for the United Kingdom, Australia, and Canada (the mother country and two other English speaking ex-colonies).
A 2020 YouGov poll in Britain found that 27% say they believe in “a god”, 16% say they believe in the existence of a higher spiritual power, but not a god, 41% do not believe in a god or a higher power and 18% don’t know. Among British Christians, just over half say they believe in God, 16% believe in a higher power, 10% don’t believe in God or higher power, and 16% don’t know.
The 2019 Australian Community Survey found that 29% of Australians say they believe in a personal God and 32% say they believe in some sort of spirit or life force. Around two in 10 (21%) do not believe and 18% remain unsure.
A very recent Canadian survey carried out in November 2022 found that just over a third of Canadians believe in God or gods (33.6%), with a further 32.1% saying that they believe in a higher power or spiritual force, but don’t necessarily believe in a god or gods. More than one-in-five (22.1%) don’t believe in any spiritual power.
My father was a Protestant minister and I grew up in a rural Protestant culture in Australia, went to lots of church services and never heard anyone trying to claim hell was a real place rather than a metaphorical place. Belief in a real hell tends to be reserved for fundamentalists who are a relatively small proportion of Christians outside USA and some other countries. I think for religious people focused on love and kindness it is clear that hell is a mythological concept dating from primitive times and literally believing your God would torture people for eternity marks you out as having premodern values. While I don’t know about the distribution of the real beliefs of individuals in the Christian community I grew up with I was not aware on any discussion of hell as a real place.
Recently, on social media forums, I’ve seen quite a few questions from Christians asking why aren’t atheists terrified of ending up in hell. And assumptions (mainly from Americans) that belief in hell is the mark of being a Christian. At least in the mainstream media, hell tends to only get a mention as part of the rantings of fundamentalists and religious extremists. These are a tiny minority in Australia and Switzerland. So I decided to see what the data from the World Values Survey (WVS) and the European Values Study (EVS) tell us about the prevalence of belief in heaven and hell.
I recently came across a headline referring to a 2016 survey in Iceland which found that 0.0% of Icelanders 25 years or younger believe God created the world. My immediate impression was that this implied a zero per cent prevalence of atheism in this age group. When I read the article, I found that the relevant question gave respondents four options: the world was created in the big bang, the world was created by God, the world was created by other means, or no opinion. Outside of countries dominated by fundamentalist religious groups, most religious people would likely choose “created in the big bang”. The survey actually found that 40.5% of respondents aged 25 years and younger said they were atheist, and 42% said they were Christians.
It is certainly the case that the prevalence of atheism is higher in younger ages in the developed countries where religiosity has been declining for decades. So I thought I would take a look at the prevalence of atheism in younger adults aged 15-34 years from the Integrated Values Surveys [1-3] that took place in the last wave, in the period 2017-2020. See my earlier posts (see here and here), which examined global, regional and country-level trends in religious belief and practice, for more details on the data and definitions of atheism and religiosity categories.
Countries with the highest prevalence of atheism and non-religion in 2017-2020
The following plot shows the prevalence of religious and irreligious adults for the 31 countries with the highest irreligious prevalence (atheists plus non-religious). China and South Korea lead these countries with irreligious prevalences over 80%, followed by Sweden, Czechia, New Zealand and Japan, with prevalences in the 70’s. In terms of atheism, there are 18 countries with prevalences over 50% in the 15-34 year age group, including Australia at 53%.
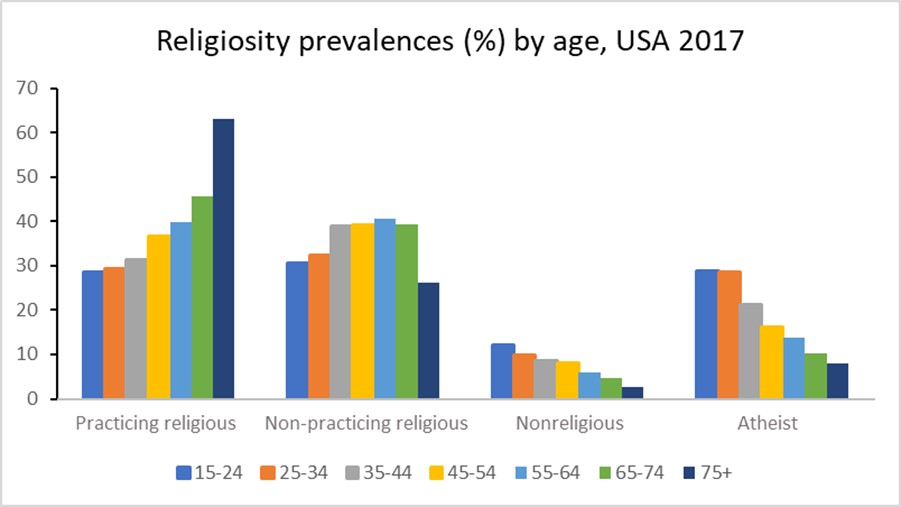
In these countries, the prevalence of practicing religious generally increases with age and the prevalence of atheists generally decreases with age. The plot for the USA 2017 survey data below illustrates this.
Are these prevalence patterns predominantly due to ageing, time period or birth cohort? Since period = birth year (cohort identifier) + age it is not possible to determine the separate effects of all three factors. Ageing as a driver of religiosity would imply that people become more religious as they get older, and this seems the least likely of the three factors to fit observed age patterns over time.
Relative contribution of cohort and period to the overall trends in religiosity
I’ve attempted to estimate the relative contributions of birth cohort and period to the evolution of religiosity in the USA using a cohort projection model. I first used the data from all waves of the US surveys to impute religiosity prevalences for years 1980, 1990, 2000, 2010, and 2020. I then projected religiosity prevalences for each age group in 2020 assuming that those prevalences remained constant at the values that age group would have had in the past when it was aged 15-24. Comparing this with the actual prevalences for 2020 allows estimation of the proportion of the change in prevalence over time that is attributable to cohort effects.
For practicing religious, non-religious and atheists, the cohort projection explains around 25% of the overall change, the other 75% is attributable to period. For the non-practicing religious, these proportions are reversed with 25% explained by period and 75% by cohort.
Projecting religiosity prevalences to 2030
My previous projections of religiosity to year 2020 were carried out using trends in all-ages-both sexes prevalences. I thought it would be interesting to explore projections at age-sex level for selected countries, given the likely variations in trends across age groups. I experimented with several statistical models including a period-cohort projection model, and a model that projected all four prevalences simultaneously, using seemingly unrelated regression techniques to constrain the prevalences to add to 100%. It proved difficult to get sensible results from these models when not tailored to specific country data. The disaggregation of survey data to 7 age groups for each sex resulted in highly variable prevalences across cells. The years for which surveys were available varied across countries in ways that made it difficult to develop generalized projection methods that were not sensitive to small number issues and outlier trends.
I eventually decided to do some quite simplistic projections for each age-sex category as follows:
Project from last available wave to 2022 using short-term trends given by last two waves
Project from 2022 to 2030 using longer-term trend from wave closest to year 2000 to last wave
Adjust extreme trends to either the smaller of the short and long run trends, or to trends for neigbouring age-sex groups.
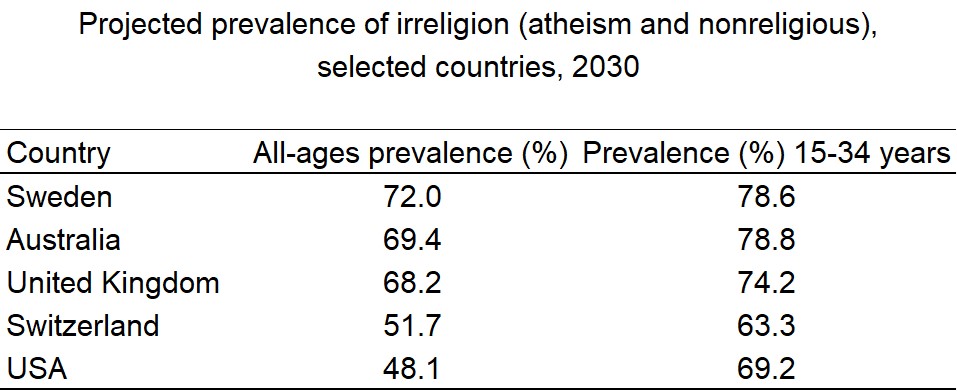
I carried out these projections for five high income countries with rising prevalence of atheism: USA, Australia, Switzerland, United Kingdom and Sweden. The following plots illustrate the observed and projected prevalences for the four religiosity categories. The dashed lines denotes the projected trend for irreligion (non-religious plus atheist).
The nonreligious category includes people who state that they believe in God, but that they are non-religious and rate the importance of God as 8-10 at the not important end of a 10-point scale. In the table below, I summarize the projected prevalence of irreligion (nonreligious or atheist) in 2030 for the five countries for all ages combined and for the young adult age group 15-34 years. The irreligion prevalence is generally higher in the younger age groups, and the 2030 value gives an indication of likely future trend for all ages.
Is irreligion likely to continue increase in the future? If the economies of high income countries continue to grow, with decreasing levels of poverty, and education levels continue to improve, it is likely that religiosity in these countries will decline in the longer term. The joint global crises of global warming and the pandemic, with rising populism and rejection of global institutions and actions, may on the other hand result in economic downturns that result in a stalling or reversal of the current religiosity trends. The situation in the USA where a religious minority is actively seeking to impose its values on the entire population, and undermining the democratic system to achieve that, may likely accelerate the turning away from religion of the young adult population. The USA already has one of the fastest rates of increase of irreligion in the last decade.
References
EVS (2021): EVS Trend File 1981-2017. GESIS Data Archive, Cologne. ZA7503 Data file Version 2.0.0, https://doi.org/10.4232/1.13736
EVS/WVS (2021). European Values Study and World Values Survey: Joint EVS/WVS 2017-2021 Dataset (Joint EVS/WVS). JD Systems Institute & WVSA. Dataset Version 1.1.0, doi:10.14281/18241.14.
Haerpfer, C., Inglehart, R., Moreno, A., Welzel, C., Kizilova, K., Diez-Medrano J., M. Lagos, P. Norris, E. Ponarin & B. Puranen et al. (eds.). 2021. World Values Survey Time-Series (1981-2020) Cross-National Data-Set. Madrid, Spain & Vienna, Austria: JD Systems Institute & WVSA Secretariat. Data File Version 2.0.0, doi:10.14281/18241.15.
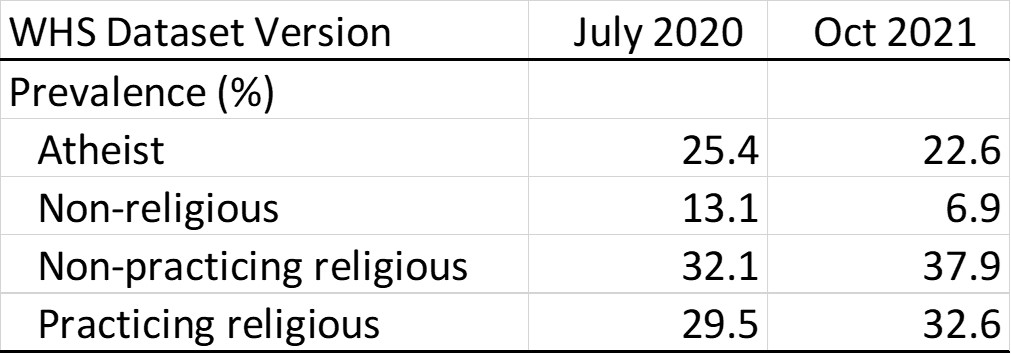
In two earlier posts (here and here), I examined global, regional and country-level trends in religious belief and practice, and the prevalence of atheism. The analysis was based on data from the World Values Survey (WVS) and the European Values Study (EVS), covering the period 1981 to 2020. Earlier this year, I discovered that the World Values Survey dataset has been updated. Some data collected using a mobile phone app in the most recent US survey was incorrectly coded and this mainly affected the religiosity categories. Comparison of the US prevalences for religiosity show that the coding errors resulted in an overestimate of the atheist and non-religious categories as shown in the following table:
Comparison of religiosity prevalence estimates for USA in year 2020
I have now updated the previous analyses using the 2021 release of the combined data for the WVS and EVS in the Integrated Values Surveys (IVS) 1981-2021 [1-3]. In carrying out these updates, I also addressed some definitional issues which have resulted in mostly slight changes to estimates for other countries. The details of the updated analysis are described elsewhere.
In a previous post, I described my use of the World Values Survey (WVS) and European Values Study (EVS) to develop a measure of pre-modern religious values (approximately corresponding to “fundamentalism”). I have used this to calculate the prevalence of pre-modern religious values using data from waves 5-7 of the surveys, covering the period 2005-2020, but with most results relating to the recent decade 2010-2020. I somewhat arbitrarily chose a cutpoint of 6.45 on the religious values scale to classify people as having pre-modern values (<6.45) versus modern values (>=6.45). The value 6.45 was chosen as the point where the distribution of scores for individuals 2 and 3 (described in the previous post) crossed over.
The following graph shows the prevalence of pre-modern values (as % of adult population) for countries in waves 5-7, ranked from lowest (Denmark at 13% and Sweden at 14%) to highest (Bangladesh, Myanmar and Qatar at 100%).
Many people outside the USA have watched with astonishment as fundamentalist Christians have aligned themselves with a serial adulterer and sexual assaulter who lost the recent election and is now seeking to undermine democracy in order to stay in power. Since first elected, Trump has worked hard to equate disagreement with treason. He has banished loyal opposition, sacked people for doing their jobs and called for the criminal investigation of ordinary opponents. But this alignment is not as bizarre as it seems on the surface. Fundamentalists share the value of demonizing and seeking to punish those they see as “other”, one of the key characteristics of fascism, as I discussed in my previous post. This applies to Christian fundamentalists and Muslim fundamentalists alike, as evidenced by the recent murders in France and Austria by Muslim terrorists angered by cartoons.
What is fundamentalism?
So I have extended my analysis of the the World Values Survey (WVS) and European Values Study (EVS) (see earlier post here) to see what it has to say about the extent of religious fundamentalism in the world today. Most religions developed in the pre-modern era and their sacred texts and teachings incorporate pre-modern culture and values to varying extents. Peter Herriot has written extensively on fundamentalist religious beliefs, characterized these movements as attempts to return to the pre-modern origins of their faith as prescribed by their sacred books [1]. He identifies five main general characteristics of fundamentalist religious movements:
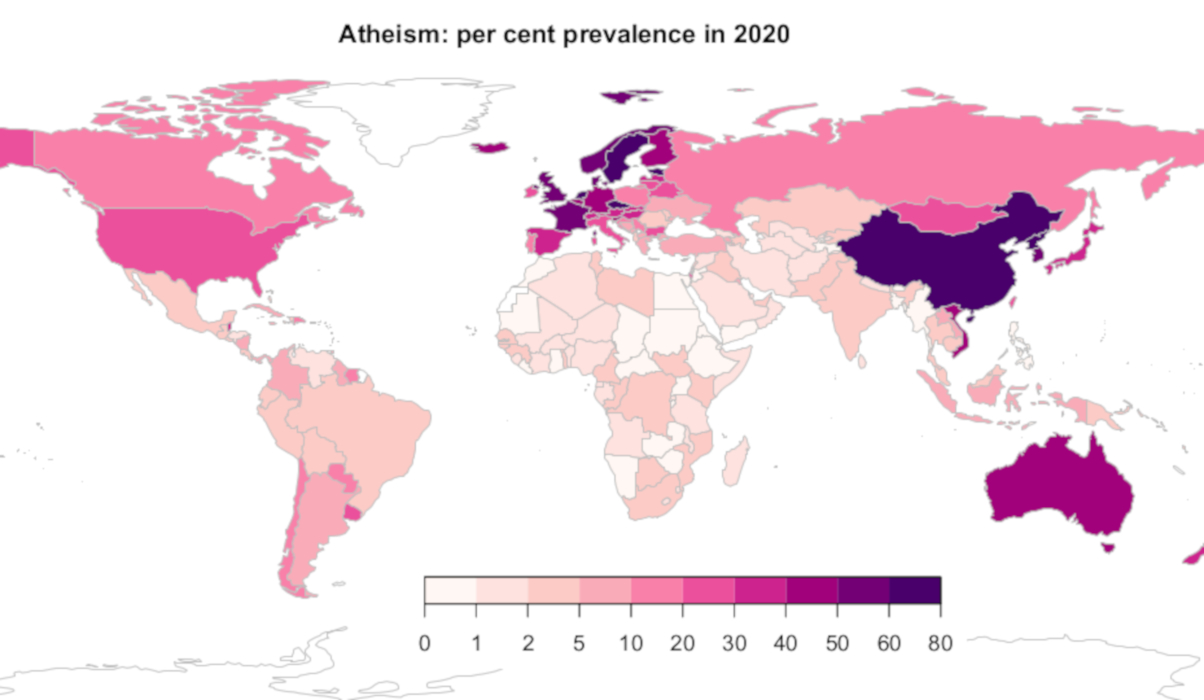
My previous post examined trends in religious belief and irreligion (non-religious and atheism) over the last 40 years using data from the World Values Surveys (WVS) and European Values Study (EVS) [1-4]. There is considerable interest in the prevalence of atheism, particularly from Americans, and a variety of quite different statistics are quoted, and have been written about in various media. In this post, I present my estimates of global prevalence of atheism for the year 2020 and discuss the various other sources of international statistics and the definitional issues. But first, here is my global map based on data from the WVS/EVS (see here for details of analysis).
And here is a closer view of the map for Eurasia. Further below in this post, I have included a more detailed country-level plot of all the religiosity categories (practicing religious, non-practicing religious, non-religious, atheist) for 2020.