The world is witnessing a coup taking place in the USA as Trump and Musk set about dismantling the US government, ignoring all congressional legislation and fiscal authority. The Constitution has effectively been suspended. Trump and Musk are leading extra-governmental operatives (young white male engineers employed by Musk) who have seized control of the Treasury payment system, and IT systems in other agencies such as USAID. They are starting to eliminate agencies created by Congress, the first being USAID. They are suspending payments authorized by law, re-interpreting the Constitution, and ignoring the judiciary. Already, several judges have made orders suspending various of their activities. They are being ignored. Ultimately, much later, such orders may end up in the Supreme Court who have already ruled that Trump has immunity for official actions.
What has led to this? How did the world’s richest man and a deeply ignorant psychopathic criminal get to seize control of government in the USA?
Benjamin Cain recently posted an article on Medium.com, The Trump Cult and the Albatross Around America’s Neck, in which he argued that the Trump cult is fueled by southern racism, religious fundamentalism, and a backlash against modernity. He claims that “In this respect, half of the US is closer to the anti-modern Islamist states than to ultra-secular Europe.”
I realized that my recent analyses of levels of pre-modern beliefs in over 100 countries included in the Integrated Values Survey (IVS) (see here and here) could be extended to check this claim. The IVS is the combined data from the World Values Survey and the European Values Study, which have carried out seven waves of surveys in over 100 countries, spanning the period 1981 to 2021.
To examine variations in pre-modern versus modern values across countries and time, I estimated a continuous latent variable “modernity” based on responses to 11 selected questions in the IVS (see following box) whose responses will vary depending on how modern or pre-modern the respondent’s values are. which assumed there is an unobserved underlying continuous variable that describes the individual’s level of modernity of values and predicts (or correlates with) their answers to specific values questions. I used general linear modelling methods to estimate a continuous latent variable “modernity” from the responses to the 11 selected values questions. See here for more details.
In Part 1 of this post, I examined global variations in the prevalence of belief in heaven or hell, both in the total adult population and among Christians and those with other religious affiliations. I found that the prevalence of belief in heaven and hell among Christians in the USA is much higher than in any of the “West” culture zones, or the Orthodox East. In the developed countries other than the USA, only 52% of Christians say they believe in heaven, and significantly fewer say they believe in hell (42%). In contrast, Christians in the USA have a much higher level of belief, and similar levels of belief in heaven (85%) and hell (81%).
In social media, I’ve seen quite a few questions from Christians to atheists, essentially asking why they do not fear going to hell. And responses from atheists like myself, who simply cannot imagine how anyone could believe that a supposedly loving god would condemn people to eternal torture for a list of transgressions which seem to vary across flavors of Christianity and to be cherry-picked from a long list of sins mainly appearing in the Old Testament. A good starting point for understanding such different views are the levels and stages of moral development identified by Kohlberg [1].
My father was a Protestant minister and I grew up in a rural Protestant culture in Australia, went to lots of church services and never heard anyone trying to claim hell was a real place rather than a metaphorical place. Belief in a real hell tends to be reserved for fundamentalists who are a relatively small proportion of Christians outside USA and some other countries. I think for religious people focused on love and kindness it is clear that hell is a mythological concept dating from primitive times and literally believing your God would torture people for eternity marks you out as having premodern values. While I don’t know about the distribution of the real beliefs of individuals in the Christian community I grew up with I was not aware on any discussion of hell as a real place.
Recently, on social media forums, I’ve seen quite a few questions from Christians asking why aren’t atheists terrified of ending up in hell. And assumptions (mainly from Americans) that belief in hell is the mark of being a Christian. At least in the mainstream media, hell tends to only get a mention as part of the rantings of fundamentalists and religious extremists. These are a tiny minority in Australia and Switzerland. So I decided to see what the data from the World Values Survey (WVS) and the European Values Study (EVS) tell us about the prevalence of belief in heaven and hell.
I recently came across a headline referring to a 2016 survey in Iceland which found that 0.0% of Icelanders 25 years or younger believe God created the world. My immediate impression was that this implied a zero per cent prevalence of atheism in this age group. When I read the article, I found that the relevant question gave respondents four options: the world was created in the big bang, the world was created by God, the world was created by other means, or no opinion. Outside of countries dominated by fundamentalist religious groups, most religious people would likely choose “created in the big bang”. The survey actually found that 40.5% of respondents aged 25 years and younger said they were atheist, and 42% said they were Christians.
It is certainly the case that the prevalence of atheism is higher in younger ages in the developed countries where religiosity has been declining for decades. So I thought I would take a look at the prevalence of atheism in younger adults aged 15-34 years from the Integrated Values Surveys [1-3] that took place in the last wave, in the period 2017-2020. See my earlier posts (see here and here), which examined global, regional and country-level trends in religious belief and practice, for more details on the data and definitions of atheism and religiosity categories.
Countries with the highest prevalence of atheism and non-religion in 2017-2020
The following plot shows the prevalence of religious and irreligious adults for the 31 countries with the highest irreligious prevalence (atheists plus non-religious). China and South Korea lead these countries with irreligious prevalences over 80%, followed by Sweden, Czechia, New Zealand and Japan, with prevalences in the 70’s. In terms of atheism, there are 18 countries with prevalences over 50% in the 15-34 year age group, including Australia at 53%.
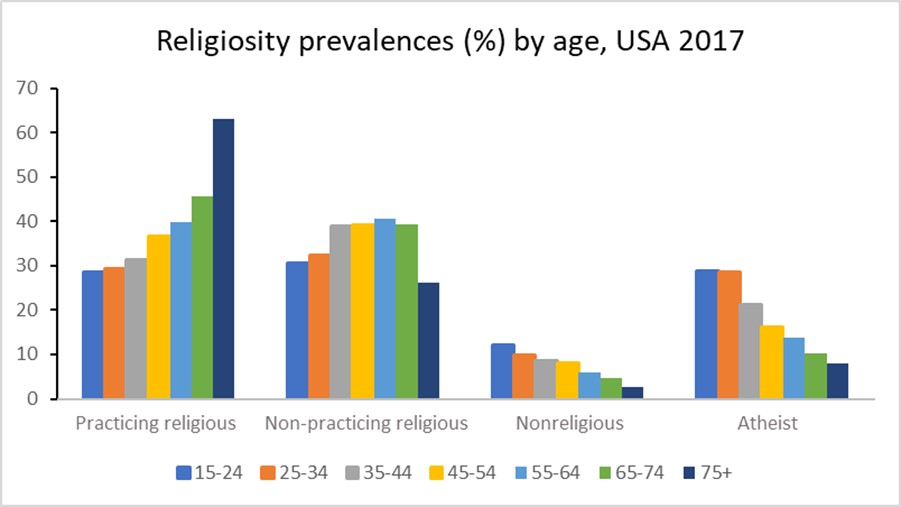
In these countries, the prevalence of practicing religious generally increases with age and the prevalence of atheists generally decreases with age. The plot for the USA 2017 survey data below illustrates this.
Are these prevalence patterns predominantly due to ageing, time period or birth cohort? Since period = birth year (cohort identifier) + age it is not possible to determine the separate effects of all three factors. Ageing as a driver of religiosity would imply that people become more religious as they get older, and this seems the least likely of the three factors to fit observed age patterns over time.
Relative contribution of cohort and period to the overall trends in religiosity
I’ve attempted to estimate the relative contributions of birth cohort and period to the evolution of religiosity in the USA using a cohort projection model. I first used the data from all waves of the US surveys to impute religiosity prevalences for years 1980, 1990, 2000, 2010, and 2020. I then projected religiosity prevalences for each age group in 2020 assuming that those prevalences remained constant at the values that age group would have had in the past when it was aged 15-24. Comparing this with the actual prevalences for 2020 allows estimation of the proportion of the change in prevalence over time that is attributable to cohort effects.
For practicing religious, non-religious and atheists, the cohort projection explains around 25% of the overall change, the other 75% is attributable to period. For the non-practicing religious, these proportions are reversed with 25% explained by period and 75% by cohort.
Projecting religiosity prevalences to 2030
My previous projections of religiosity to year 2020 were carried out using trends in all-ages-both sexes prevalences. I thought it would be interesting to explore projections at age-sex level for selected countries, given the likely variations in trends across age groups. I experimented with several statistical models including a period-cohort projection model, and a model that projected all four prevalences simultaneously, using seemingly unrelated regression techniques to constrain the prevalences to add to 100%. It proved difficult to get sensible results from these models when not tailored to specific country data. The disaggregation of survey data to 7 age groups for each sex resulted in highly variable prevalences across cells. The years for which surveys were available varied across countries in ways that made it difficult to develop generalized projection methods that were not sensitive to small number issues and outlier trends.
I eventually decided to do some quite simplistic projections for each age-sex category as follows:
Project from last available wave to 2022 using short-term trends given by last two waves
Project from 2022 to 2030 using longer-term trend from wave closest to year 2000 to last wave
Adjust extreme trends to either the smaller of the short and long run trends, or to trends for neigbouring age-sex groups.
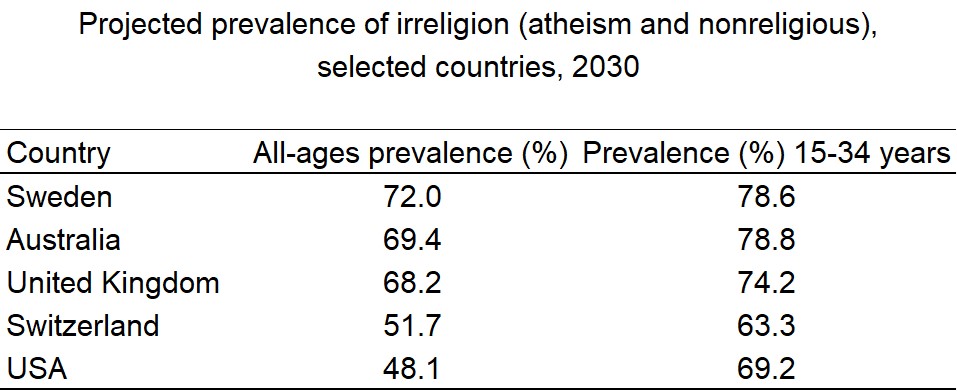
I carried out these projections for five high income countries with rising prevalence of atheism: USA, Australia, Switzerland, United Kingdom and Sweden. The following plots illustrate the observed and projected prevalences for the four religiosity categories. The dashed lines denotes the projected trend for irreligion (non-religious plus atheist).
The nonreligious category includes people who state that they believe in God, but that they are non-religious and rate the importance of God as 8-10 at the not important end of a 10-point scale. In the table below, I summarize the projected prevalence of irreligion (nonreligious or atheist) in 2030 for the five countries for all ages combined and for the young adult age group 15-34 years. The irreligion prevalence is generally higher in the younger age groups, and the 2030 value gives an indication of likely future trend for all ages.
Is irreligion likely to continue increase in the future? If the economies of high income countries continue to grow, with decreasing levels of poverty, and education levels continue to improve, it is likely that religiosity in these countries will decline in the longer term. The joint global crises of global warming and the pandemic, with rising populism and rejection of global institutions and actions, may on the other hand result in economic downturns that result in a stalling or reversal of the current religiosity trends. The situation in the USA where a religious minority is actively seeking to impose its values on the entire population, and undermining the democratic system to achieve that, may likely accelerate the turning away from religion of the young adult population. The USA already has one of the fastest rates of increase of irreligion in the last decade.
References
EVS (2021): EVS Trend File 1981-2017. GESIS Data Archive, Cologne. ZA7503 Data file Version 2.0.0, https://doi.org/10.4232/1.13736
EVS/WVS (2021). European Values Study and World Values Survey: Joint EVS/WVS 2017-2021 Dataset (Joint EVS/WVS). JD Systems Institute & WVSA. Dataset Version 1.1.0, doi:10.14281/18241.14.
Haerpfer, C., Inglehart, R., Moreno, A., Welzel, C., Kizilova, K., Diez-Medrano J., M. Lagos, P. Norris, E. Ponarin & B. Puranen et al. (eds.). 2021. World Values Survey Time-Series (1981-2020) Cross-National Data-Set. Madrid, Spain & Vienna, Austria: JD Systems Institute & WVSA Secretariat. Data File Version 2.0.0, doi:10.14281/18241.15.
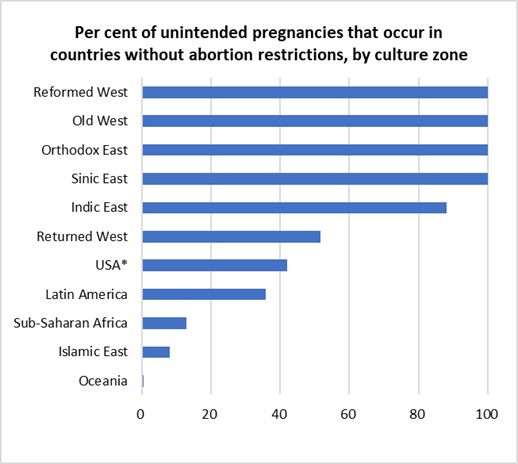
In my previous post, I estimated that 47% of pregnancies are unintended, and of these, 43% occur in countries where abortion is illegal or severely restricted. In countries where abortion is widely available, 71% of unintended pregnancies are aborted compared to 46% in countries with severe restrictions.
The World Health Organization (WHO) estimates that around one-third of the 23 million induced abortions carried out each year in countries where abortion is severely restricted are performed under the least safe conditions, by untrained persons using dangerous and invasive methods. Safe abortion is an essential health care service. It is a simple intervention that can be effectively managed by a wide range of health workers using medication or a surgical procedure. In the first 12 weeks of pregnancy, a medical abortion can also be safely self-managed by the pregnant person at home.
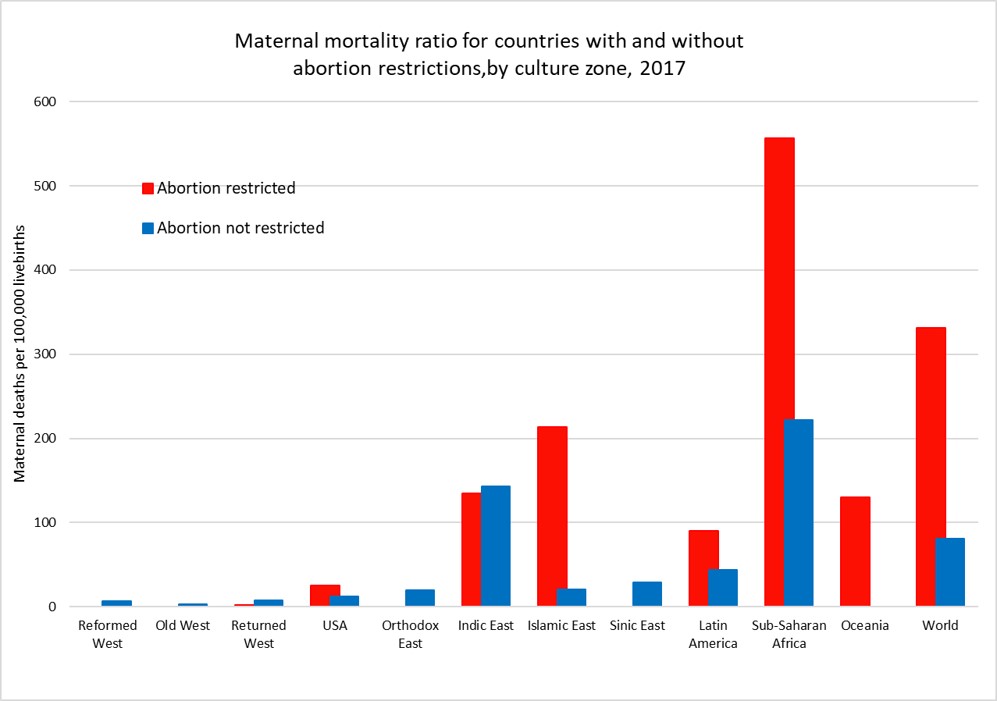
Maternal mortality is defined as death while pregnant or within 42 days of the end of pregnancy from any cause related to or aggravated by the pregnancy or its management. The plot above shows the average maternal mortality ratio (MMR) per 1,000 live births for countries (and US states) grouped by access to abortion and culture zone for the year 2017 (see here for more details).
While countries that restrict abortion have higher MMRs than those that don’t for most of the culture zones, we cannot conclude that abortion restriction per se is responsible for the difference. Abortion restriction is also correlated with other determinants of higher MMR such as lower average income per capita, less access to health care, and higher levels of discrimination against women.
The global MMR has declined from 345 per 100,000 livebirths in 2000 to 212 per 100,000 livebirths in 2017, a 40% decrease in 17 years. There have been substantial declines in MMR in every culture zone except for the Reformed West and Old West where MMR rates were already very low in 2000 and in the USA where rates have risen substantially during the 21st century.
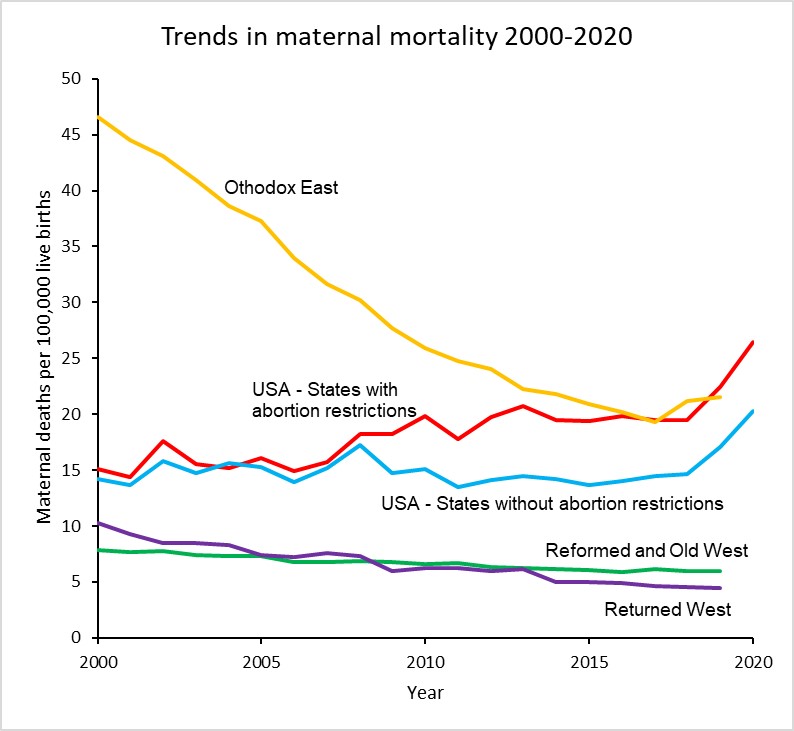
The plot below takes a closer look at MMR trends in the USA, the Reformed and Old West, the Returned West and the Orthodox East. The latter two culture zones include the former Soviet bloc countries. With the exception of Poland in the Returned West, all these culture zones except the USA do not restrict access to abortion services and allow abortion on request or in some countries on “economic and social grounds”.
The maternal mortality ratio for the USA has increased from around 15 per 100,000 livebirths in 2000 to 23.8 in 2020, a 62% increase. Abortion rates in States which now restrict abortion were similar to those in states which don’t until 2008 and afterwards diverged substantially. The rate for states with restrictions was 26.4 in 2020, 30% higher than the MMR of 20.2 for states without restrictions.
There has been considerable controversy about the substantial increase in maternal mortality in the USA, particularly as to whether it is associated with improvements in the identification and reporting of maternal deaths. The addition of a pregnancy checkbox to death records from 2003 onwards is thought to have led to some increase in estimated MMRs in the early 2000s, but several studies have also identified that increasing restrictions on the general availability of reproductive health services have played a major role, particularly in states restricting access to abortion.
Hawkins et al (2019) found that a 20% reduction in the numbers of Planned Parenthood clinics resulted in an 8% increase in maternal mortality and states that enacted legislation to restrict abortions based on gestational age increased the maternal mortality rate by 38%.
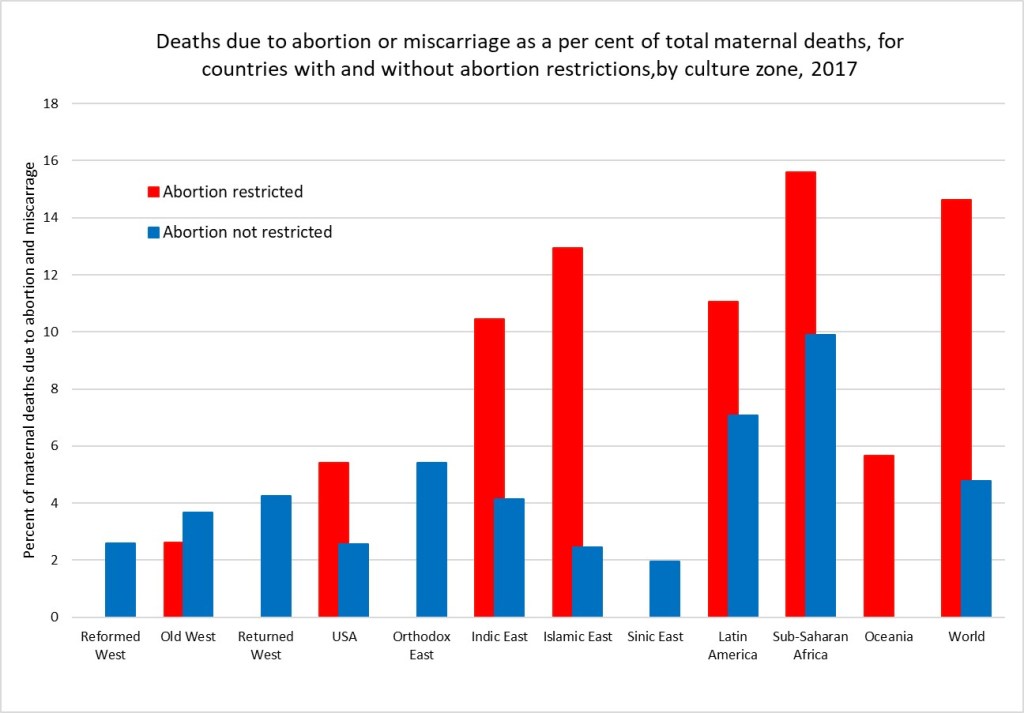
A 2020 study by the Commonwealth Fund compared maternity care in the USA with 10 other developed countries and found that the USA has the highest maternal mortality among developed countries and that there is an overall shortage of maternity care providers (obstetrician-gynecologists and midwives). The USA has 12 to 15 providers per 1,000 livebirths, and all the other developed countries have a supply that is between two and six times greater. Although a large share of its maternal deaths occur postbirth, the U.S. is the only country not to guarantee access to provider home visits or paid parental leave in the postpartum period. In the early 2000s, WHO estimated that unsafe abortion accounted for around 13% of total global maternal deaths, then estimated to be around half a million deaths per year. A more recent study by WHO staff and academic colleagues in 2014 estimated that abortion accounted for 7.9% of maternal deaths at global level between 2003 and 2009. Recent WHO estimates for global deaths by cause do not include deaths due to induced abortion. I have elsewhere used results from the Global Burden of Disease Study 2019 to estimate very approximately the proportion of maternal deaths due to abortion and miscarriage for the period 2015-2019. These would include induced abortion deaths as well as deaths due to spontaneous abortions and miscarriages. The following plot shows the estimated average percent of maternal deaths attributed to abortion and miscarriage for countries with and without abortion restrictions in each culture zone.
Overall, I estimate that there were 75,500 deaths globally due to abortion and miscarriage in 2017 (these include spontaneous events as well as induced abortions). Of these 70,300 were in countries with abortion restrictions. Assuming the rate in countries with unrestricted abortion relates to the spontaneous events, I have estimated that abortion restrictions resulting in unsafe abortions caused 54,350 deaths in 2017. If all abortions were safe, there would have been only 21,200 deaths globally due to spontaneous abortion and miscarriage in 2017.
Its quite possible these very back-of-the-envelope estimates are under-estimates. Classification of maternal deaths due to abortion, and more specifically unsafe abortion, is associated with a risk of misclassification. Even where induced abortion is legal, religious and cultural perceptions in many countries mean that women do not disclose abortion attempts and relatives or health-care professionals do not report deaths as such.
A medical abortion procedure uses the drugs mifepristone and misoprostol which can be taken in pill form up until the 12th week and are very safe.They require no surgery or anaesthesia. These drugs were developed in 1980 and first became available for induced abortions in France in 1987. It became available in the USA in 2000 and is on the WHO list of essential medicines. Cost and availability limits access in many parts of the developing world.
It is usually possible to carry out this procedure oneself at home. During the covid pandemic, a number of countries including the UK have made abortion accessible via an online consultation after which the pills are sent by post to the woman to take at home. The Netherlands-based charity Women on Web aims to prevent unsafe abortions by providing abortion pills to women in countries where safe abortion is available.
In December 2021, the FDA made permanent a covid-era policy allowing abortion pills to be prescribed via telehealth and distributed by mail in US states that permit it.Even before the FDA action,abortions induced by pills rose to more than 54 percent of all U.S. abortions in 2020, according to the Guttmacher Institute. Nineteen states have banned prescription of these pills via online consultation, requiring the woman visit a physician. And of course, in states which severely restrict abortion, this will require a completely unnecessary trip out of state.
Women on Web is making medical abortion available to women in the USA and elsewhere who are facing these restrictions. The cost for a woman to obtain the pills for a medical abortion is 90 Euros, or around 100 US dollars. You can donate to fund abortions for women unable to afford them here. Or to US based abortion funds here.
While legal abortions done under the guidance of a professional are the gold standard. Self-managed abortion can be safe, too, if you have the right information. But as I noted above, the banning of abortion typically goes hand-in-hand with restrictions on contraception and reproductive health services, as well as discrimination and other restrictions on women that result in higher maternal mortality rates, more femicide and abuse, less access to education and employment, and greater female poverty levels.
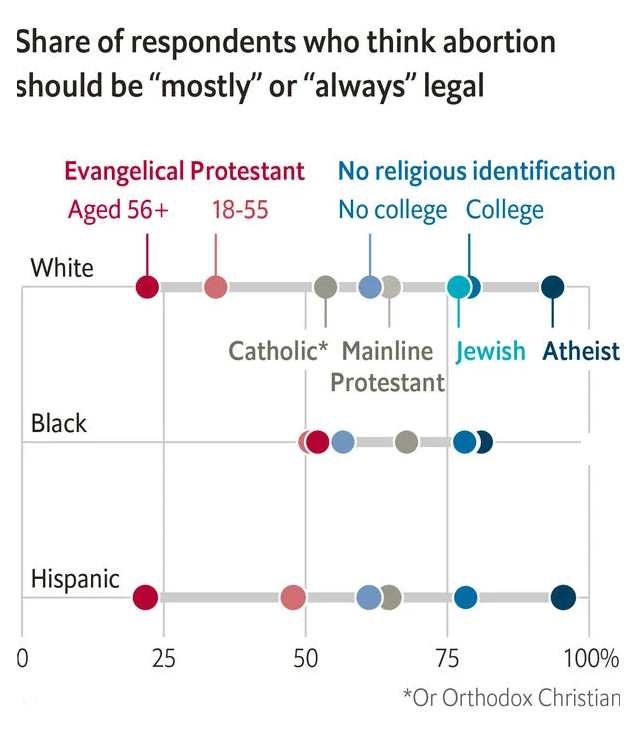
The removal of a basic reproductive rights for women in the USA is being driven by a minority, many of whom are fundamentalist Christians. According to a recent survey, white and Hispanic fundamentalists are the only religious group in the USA for which a majority oppose the legal availability of abortion (The Economist, May 7, 2022).
I discussed in a previous post how enforcement of social norms governing human fertility have been a major factor in pre-modern religions. For thousands of years, very high levels of child mortality and other survival pressures meant that most societies sought to ensure that women produced as many children as possible and discouraged divorce, abortion, homosexuality and contraception. Additionally sexual behaviour, particularly that of women and that not linked to reproduction, was strongly socially controlled to minimise uncertainty about paternity. Religion was the primary method of social control and pre-modern values regarding women’s rights, reproduction and sexuality are still dominant in most of the major religions, particularly fundamentalist forms. In a world facing overpopulation, global warming, habitat destruction and species extinction, it is crucial that outdated and cruel pre-modern values do not condemn women to reproductive slavery and an inability to control their own fertility, and reduce our ability to address these inter-related crises using all the tools and knowledge now available.
Many of us here in Europe and Australia are watching in horror as the US Supreme Court moves towards taking away the reproductive freedom of US women. And from the noises being made by Republican politicians, access to contraceptives, gay marriage and any other human rights not recognized in the 16th century are at risk also.
During my close to two decades responsible for WHO global health statistics, I worked closely with the maternal health department on regular assessments of maternal mortality, including deaths due to unsafe abortion. My team collaborated with the Guttmacher Institute on several occasions to produce global statistics on induced abortion. Given the current situation, I was interested to see that the Guttmacher Institute and WHO released first-ever country-level estimates of unintended pregnancy and abortion (see here) a little under two months ago.
The new study analysed data for 150 countries for the period 2015-2019, and found that:
Almost half of the 220 million pregnancies globally per year are unintended.
Six in 10 unintended pregnancies end in an induced abortion (63 million per year).
Overall, 29% of all pregnancies globally end in an induced abortion.
Regional averages mask large disparities within regions for unintended pregnancy and abortion rates.
The Guttmacher/WHO study covers 90% of the 1.9 billion women of reproductive age. Almost all the missing countries (because of lack of data) are in the Western Asia and Northern Africa region, most of them Islamic states or with a dominant Islamic culture. I describe elsewhere how I imputed data for most of the missing countries and added data on legal grounds and restrictions regarding abortion. Countries classified as having abortion restrictions are those which completely prohibit abortion or allow abortion only on one or more of the following grounds: risk to life, risk to health, rape or fetal impairment. Countries classified as without abortion restrictions also allowed abortion on social or economic grounds, or on request. Given the polarization of the US states in allowing or restricting abortion, I also used information from Planned Parenthood to classify US states into two groups with and without restrictions.
First, a brief overview at the global level of the differences between grouped countries with and without restrictions:
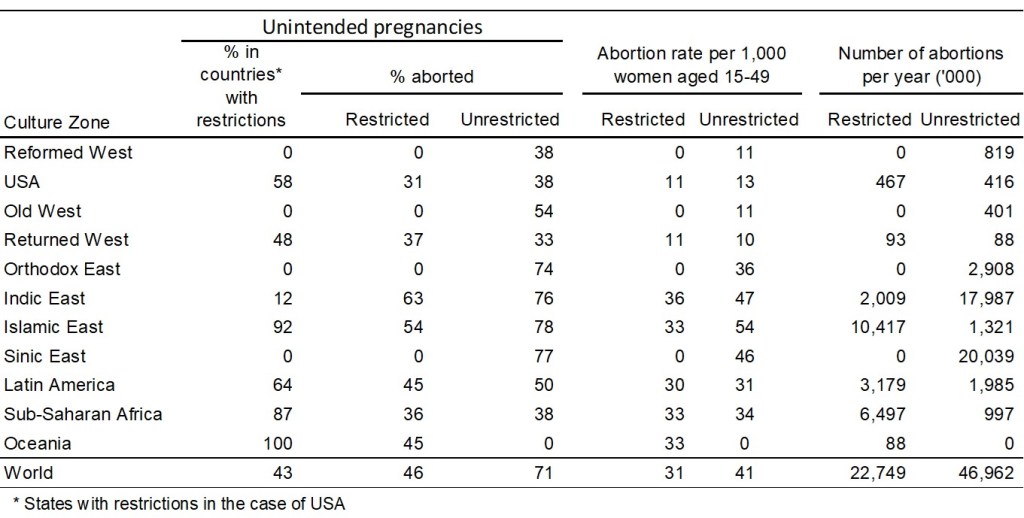
36% of women of reproductive age live in countries with restricted access to abortion. These countries account for 33% of global abortions, 50% of global live births and 81% of global maternal deaths.
The global abortion rate per 1,000 women aged 15-49 years is 31 for countries with restrictions and 41 for countries without restrictions.
21% of pregnancies are terminated by abortion in countries with restrictions, 34% in countries without restrictions.
Average GDP per capita (purchasing power parity dollars) was $18,300 in countries without restrictions, and 71% of women aged 15-49 used modern forms of contraception. For countries with restrictions, the average GPD/capita was $8,500 and only 57% of women used modern forms of contraception.
Countries restricting abortion were much more religious with 66% of adults attending religious services at least once a month, compared to 27% in countries not restricting abortion (data on religious practice from the World Values Survey and European Values Study, see earlier post here).
These global averages conceal very large differences across regions, and between countries in some regions. I have examined these patterns by grouping countries into 11 culture zones, based on those developed by Welzel (2013) for the World Values Survey.
I modified the culture zones slightly, to include Canada in the Reformed West and keep the USA in its own separate category. I also moved predominantly Muslim countries from “Indic East” and “Sinic East to group together all countries with a predominantly Islamic culture and values. See here for full definitions of the culture zones.
Figure 1
Figure 2.
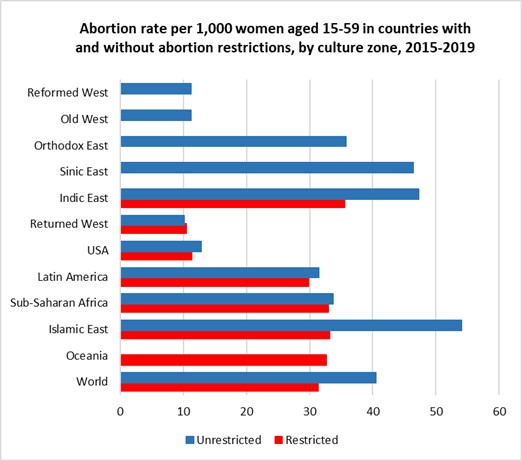
The left-hand figure 1 shows that abortion is universally legally available in most of Europe, Canada, Australia and New Zealand, in the Orthodox and Islamic countries of the former Soviet-bloc and in the non-Islamic countries of Asia. It is legally severely restricted in most Islamic countries and sub-Saharan Africa. Abortion rates are substantially lower in the high-income countries of Europe, North America and Australia and New Zealand than in the Asian regions where abortion is unrestricted AND in the countries in all developing regions irrespective of whether abortion is legally restricted or available. Note that USA results have been calculated by grouping States into those with and without significant abortion restrictions.
For 2015-2019, almost half of unintended pregnancies (46%) were aborted in countries where abortion was restricted (often severely) and a little over two-thirds (70%) in countries where abortion is accessible. In the three regions where around 40-50% of women with unintended pregnancies have restricted access to abortions, overall abortion rates per 1,000 women of reproductive age differ by less than 2 abortions per 1,000 from those in countries (or US states) without restrictions. These are the USA (11 versus 13 per 1,000), the Returned West (11 versus 10 per 1,000) and Latin America (30 versus 31 per 1,000). The Returned West consists of former Soviet-bloc countries that have joined the EU, and the largest of these, Poland, is the only one to have restricted abortion, prohibiting it for fetal impairment, economic or social reasons, or on request.
People seek and obtain abortions in all countries, even in those with restrictive abortion laws, where barriers to safe abortion care are high. In fact, over the past three decades, the proportion of unintended pregnancies that end in abortion has increased in countries that have many legal restrictions in place. The figures presented above suggest that the illegalization of abortion will not substantially reduce its incidence. Over recent decades, most of the changes to the legal grounds for abortion have been in the direction of recognizing women’s rights to reproductive autonomy (recent examples include Ireland, Argentina, Mexico and Columbia).
The increasing restrictions in the USA are one of the few examples of major reductions in women’s rights occurring outside the Islamic countries. In the case of the USA, these changes are to rights that women have had for half a century and are being driven by an anti-democratic coalition of white nationalists and religious extremists who do not represent the majority views of the population. A recent issue of the Economist identified white evangelicals as the one major religious group with majority opposition to the legal availability of abortion (The Economist, May 7, 2022). A majority of Catholics, mainline Protestants and those with no religious identification think that abortion should be mostly or always legal in the USA, and support is over 75% for Jewish, atheists and non-religious with college education.
The rhetoric of some US extremists, and actions already taken to restrict health insurance coverage for contraceptive use, suggests that further restriction on abortion access may well also be accompanied by further reductions in contraceptive availability. The unintended pregnancy rate may well increase, resulting in an overall increase in numbers of abortions occurring, even if the restrictions reduce the percentage of unintended pregnancies that end in abortion. In my next post, I will examine differences in maternal mortality across countries and the extent to which they are associated with legal restrictions on abortion.
A little under two months ago, the Guttmacher Institute and WHO released first-ever country-level estimates of unintended pregnancy and abortion (see here). The new study analyzed data for 150 countries for the period 2015-2019 and found that:
Almost half of the 220 million pregnancies globally per year are unintended.
Six in 10 unintended pregnancies end in an induced abortion (63 million per year).
Overall, 29% of all pregnancies globally end in an induced abortion.
Almost 30% of induced abortions occur in countries where abortion is either illegal or heavily restricted. Earlier estimates for 2010-2014 found that 45% of all abortions are unsafe, and around 15% were performed in the least safe conditions, by untrained persons using dangerous and invasive techniques.
Regional averages mask large disparities within regions for unintended pregnancy and abortion rates.
The Guttmacher/WHO study covers 90% of the 1.9 billion women of reproductive age. Almost all the missing countries (because of lack of data) are from the Western Asia and Northern Africa region, most of them Islamic states or with a dominant Islamic culture. I describe below how I imputed data for most of the missing countries, added data on legal grounds and restrictions regarding abortion and examine global patterns using 12 culture zones which group countries based on history, values and religion.
The following plots give a taste of the global patterns I found. Culture zone and other definitions, data and methods are given in more detail in the rest of this post.
Figure 1.
Figure 2.
*Note that USA results have been calculated by grouping States into those with and without significant abortion restrictions
The left-hand figure shows that abortion is universally legally available in most of Europe, Canada, Australia and New Zealand, in the Orthodox and Islamic countries of the former Soviet-bloc and in the non-Islamic countries of Asia. It is legally severely restricted in most Islamic countries and sub-Saharan Africa. Abortion rates are substantially lower in the high-income countries of Europe, North America and Australia and New Zealand than in the Asian regions where abortion is unrestricted AND in the countries in all developing regions irrespective of whether abortion is legally restricted or available. Note that USA results have been calculated by grouping States into those with and without significant abortion restrictions.
For 2015-2019, almost half of unintended pregnancies (46%) were aborted in countries where abortion was restricted (often severely) and a little over two-thirds (70%) in countries where abortion is accessible. In the three regions where around 40-50% of women with unintended pregnancies have restricted access to abortions, overall abortion rates per 1,000 women of reproductive age differ by less than 2 abortions per 1,000 from those in countries (or US states) without restrictions.
Imputation of data for countries in Western Asia and Northern Africa
The 150 countries with abortion-related data represent 90% of the 1.9 billion women of reproductive age 15-49 years in the period 2015-2019. Of the eight Sustainable Development Goals (SDG) regions used in the study, the coverage of reproductive-age women by countries with data fell below 95% only for Western Asia and Northern Africa, where data coverage was only 3.4%. However, the missing women are almost entirely in one SDG region, Western Asia and Northern Africa
The region includes 24 countries, mostly in North Africa and the Middle East. Data is available only for Azerbaijan, Armenia and Georgia. These are all former Soviet-bloc countries with legal abortion and high rates of termination of unintended pregnancies. In contrast, apart from Israel and Cyprus, the other 19 countries are all either explicitly Islamic states or with a predominant Islamic culture. Seventeen of the 19 either prohibit or severely restrict abortion.
To address the bias inherent in excluding these countries from global statistics, I decided to impute the unintentional pregnancy rates and abortion rates for the Islamic countries in North Africa and the Middle East and also for Afghanistan, Iran and Malaysia, using information on live birth rates for these countries along with the abortion data for 22 Islamic countries in the neighbouring regions Sub-Saharan Africa, South-central Africa and South-eastern Asia. Former Soviet-bloc Islamic countries were not included in this dataset.
Pregnancy rates were regressed against live birth rates for this dataset and the regression model (R-squared 0.91) used to predict pregnancy rates for the missing data. Unintended pregnancies are defined as pregnancies which were unwanted at the time they were conceived or occurred earlier than desired. Explorations of various covariates for predicting the proportion of pregnancies that are unintentional resulted in predicting of missing data using a regression on the log of GDP per capita measured in international (purchasing-power-parity adjusted) dollars and a continuous variable measuring average-religiosity for countries in 2017. Both these variables are significant predictors of the proportion of pregnancies that are unintentional and the regression on the prediction dataset has an R-squared of 0.52. I used previously estimated levels and trends in average religiosity (practicing, non-practicing, non-religious and atheist) for countries using data from the World Values Survey (WVS) and European Values Study (EVS) covering the period 1980 to 2020 (see previous post here).
The only predictive variable found for the proportion of unintentional pregnancies resulting in induced abortion was the gender inequality index produced by United Nations Development Program. Regression of logit(abortion fraction of unintended pregnancies) against the logit of the 2017 value of the gender inequality index was used to predict missing abortion fractions of unintended pregnancies (R-squared 0.7).
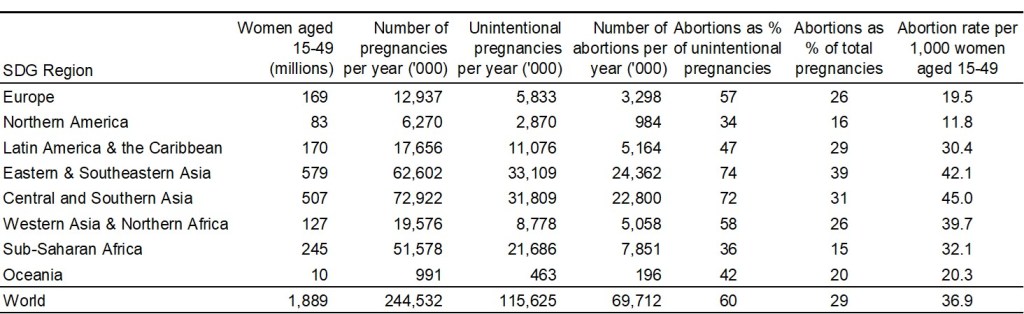
Global and regional abortion rates for 2015-2019
With these missing values imputed for 23 countries, the abortion estimates now cover most countries in most regions, and 98.6% of women of reproductive age globally. Based on this extended dataset, the following table summarizes regional and global patterns of pregnancy and abortion for the period 2015-2019.
The Guttmacher/WHO paper in the British Medical Journal displays unintended pregnancy and abortion rates by country for the 150 countries included in their study. The estimates dataset is available here. It includes 80% and 95% uncertainty intervals. In this post, I’m interested to see the big picture at regional and global level, and I’ve not done the additional work to estimate uncertainty intervals. But it is important to keep in mind that there are many problems with data availability, reliability and completeness of reporting, particularly for an often stigmatized and contentious issue such as abortion. So the broad patterns shown below likely convey a reasonable and evidence-based assessment, but small differences between countries or regions should not be over-interpreted.
Legal restrictions in countries and US States
The legality and acceptability of abortion varies widely across the world, from Europe where it is available without restriction in most countries, to the Middle East and Africa where it is largely illegal.
I’ve taken country-level information on abortion availability and restrictions from Wikipedia, which documents legal grounds on which abortion is permitted, and gestational age limits where relevant, using the following six categories: risk to life, risk to health, rape, fetal impairment, economic or social reasons, on request. The first four of these grounds cover a fairly small percentage of unintended pregnancies and I have grouped in a single category “restricted or prohibited” countries which allow abortion only on these grounds. Countries which allow abortions on economic or social grounds or on request (with any gestational age limit set at least 10 weeks or longer) are classified as “unrestricted”. The USA has widely varying legal restrictions on abortions across the 50 states and Washington DC. I have used information on abortion access from Planned Parenthood to classify abortion access as restricted (28 states) and unrestricted (22 states and Washington DC).
Revised culture groups for countries
In earlier posts, I analyzed religious and other values by culture groups for 110 countries using data from the World Values Surveys and the European Values Study. These culture zones were based on the 11 culture zones developed by Welzel (2013).
For this post, I’ve slightly revised the culture zones to group Canada with Australia and New Zealand in the “Reformed West” zone, and kept the USA as a single separate culture zone. I’ve also revised the categories “Indic East”, “Sinic East”, and Islamic East to group together all countries with a predominantly Islamic culture and values. The revised culture zones are as follows:
Reformed West — Western European societies strongly affected by the Reformation: Denmark, Finland, France, Germany, Iceland, Netherlands, Norway, Sweden, Switzerland, United Kingdom, plus Canada, Australia and New Zealand;
USA — The North American culture zone included only two countries, USA and Canada. Canada’s culture is very similar to the Reformed West, and it is moved there.
Old West — Mostly Catholic parts of Western Europe being core parts of the Roman Empire: Austria, Belgium, Cyprus, Greece, Ireland, Israel, Italy, Luxembourg, Malta, Portugal, Spain;
Returned West — Catholic and Protestant parts of post-communist Europe returning to the EU: Croatia, Czechia, Estonia, Hungary, Latvia, Lithuania, Poland, Slovakia, Slovenia;
Orthodox East — Christian Orthodox or Islamic parts of the post-communist world, mostly parts of former USSR;
Indic East — Parts of South and South East Asia under the historic influence of Indian or Buddhist culture: Bhutan, Cambodia, India, Laos, Malaysia, Myanmar, Nepal, Philippines, Singapore, Sri Lanka, Thailand, Timor-Leste;
Islamic East — Countries with predominantly Islamic religion and culture;
Sinic East — Parts of East Asia under the historic influence of Chinese culture and/or Buddhism: China, Japan, Mongolia, North Korea, South Korea, Taiwan, Vietnam;
Latin America — Central and South America and the Caribbean;
Sub-Saharan Africa — African countries south of the Sahara.
Oceania — Papua New Guinea and other Pacific Island countries.
Patterns of abortion by culture group
The table below summarizes the abortion situation for countries without legal restrictions and countries with legal restriction in each culture zone. Country-level legal status is used except for the USA where the statistics relate to two groups of states: those with and without legal restrictions on abortion (as defined above). State level estimates are not available for the per cent of unintended pregnancies, or the per cent that are aborted. I have assumed that the national percent of all pregnancies that are unintended (34%) is the same in the two groups of states, and that the % aborted in states without restrictions is the same (38%) as that in the Reformed West where abortion is 100% unrestricted. Since the national level of unintended pregnancies that are aborted is 34%, this implies that the proportion of unintended pregnancies aborted in states with restrictions is 31%.
To graphically illustrate these variations across culture zones, I repeat the two figures included near the beginning of this post:
Figure 1.
Figure 2.
Globally, 60% of unintended pregnancies ended in abortion in the period 2015-2019. People seek and obtain abortions in all countries, even in those with restrictive abortion laws, where barriers to safe abortion care are high. In fact, over the past three decades, the proportion of unintended pregnancies that end in abortion has increased in countries that have many legal restrictions in place. For 2015-2019, almost half of unintended pregnancies (46%) were aborted in countries where abortion was restricted (often severely) and a little over two-thirds (70%) in countries where abortion is accessible.
In the three regions where around 40-50% of with unintended pregnancies have restricted access to abortions, overall abortion rates per 1,000 women of reproductive age differ by less than 2 abortions per 1,000 from those in countries (or US states) without restrictions. These are the USA (11 versus 13 per 1,000), the Returned West (11 versus 10 per 1,000) and Latin America (30 versus 31 per 1,000). The Returned West consists of former Soviet-bloc countries that have joined the EU, and the largest of these, Poland, is the only one to have restricted abortion, prohibiting it for fetal impairment, economic or social reasons, or on request.
The figures presented above suggest that the illegalization of abortion will not substantially reduce its incidence. Over recent decades, most of the changes to the legal grounds for abortion have been in the direction of recognizing women’s rights to reproductive autonomy (recent examples include Ireland, Argentina, Mexico and Columbia). Removal of a right that women have had for 50 years in the USA is an entirely different situation.
The increasing restrictions in the USA are one of the few examples of major reductions in women’s rights occurring outside the Islamic countries where religious extremists have taken control of government. In the case of the USA, these changes are to rights that women have had for half a century and are being driven by an anti-democratic coalition of white nationalists and religious extremists who do not represent the majority views of the population. A recent issue of the Economist identified white evangelicals as the one major group with majority opposition to the legal availability of abortion. A majority of Catholics, mainline Protestants and those with no religious identification think that abortion should be mostly or always legal in the USA, and support is over 75% for Jewish, atheists and non-religious with college education.
Reproduced from: Religion, not gender, is the best predictor of views on abortion.The Economist, May 7th 2022.
The rhetoric of some US extremists, and actions already taken to restrict health insurance coverage for contraceptive use, suggests that further restriction on abortion access may well also be accompanied by further reductions in contraceptive availability. The unintended pregnancy rate may well increase, resulting in an overall increase in numbers of abortions occurring, even if the restrictions reduce the percentage of unintended pregnancies that end in abortion.
In my next post, I will examine differences in maternal mortality across countries and the extent to which they are associated with legal restrictions on abortion.
Watching scenes from Kabul airport recently felt like déjà vu for me. The Vietnam War ended in eerily similar scenes. I’ve been astonished to read more than one article that has described the events in Afghanistan as an unprecedented military defeat for the USA, or as a sign that the era of neoliberal intervention in foreign countries was over. If the USA did not learn anything from Vietnam, why would we assume it will this time when facts and evidence are even less valued than in the past. Several commentators have noted the intersection of the US war on terror and the war on drugs in Afghanistan. I have been engaged for nearly 20 years now in work to update global estimates of conflict deaths and global estimates of deaths attributable to drug use. I was curious to look a little more closely at relevant statistics.
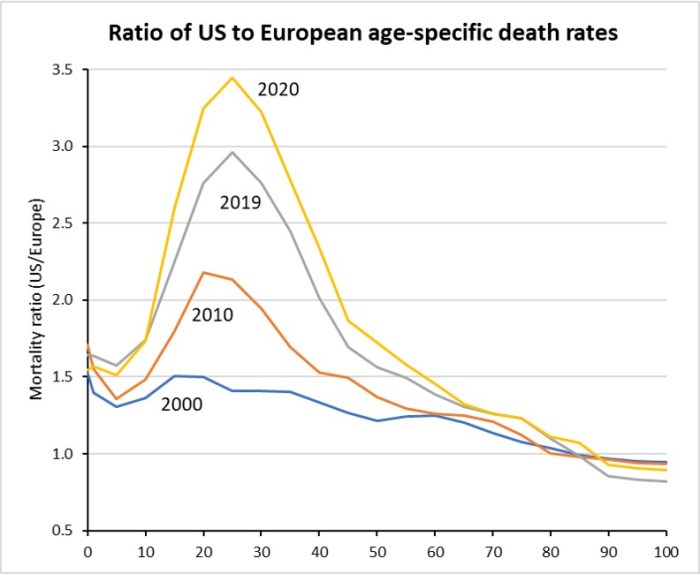
A recent paper by demographers Sam Preston and Yana Vierboom showed that there are an additional 400,000 deaths in the USA in 2017 that would not have occurred it the USA experienced European death rates. That is about 12% of all American deaths and higher than the COVID-19 death toll of around 380,000 in 2020. In a Guardian article earlier this month they identified major factors contributing to this US “mortality penalty” including overweight and obesity, drug overdose, lack of health insurance, suicide, lack of gun control and racism. These deaths tend to occur at younger ages than Covid deaths on average, so that total potential years of life lost are three times greater for the excess deaths than for Covid in 2020 (13 million versus 4.4 million).
Preston and Vierboom used data from the Human Mortality Database (HMD) for their analysis. They calculated death rates based on the five largest European countries, whose combined population size is very similar to that of the United States: Germany, England and Wales, France, Italy, and Spain. They also argued that using these larger European countries to provide a mortality standard would avoid unrealistic expectations that might result from comparisons including small countries with possibly exceptional combinations of factors affecting mortality (e.g., climate, diet, social history, and healthcare delivery).
A few days ago, I downloaded updated data from the HMD and replicated and extended their analysis to include years up to and including 2020, drawing on recent data from Eurostat and national health statistics agencies (see here for details of data, sources and methods).